What is IT Infrastructure Monitoring?
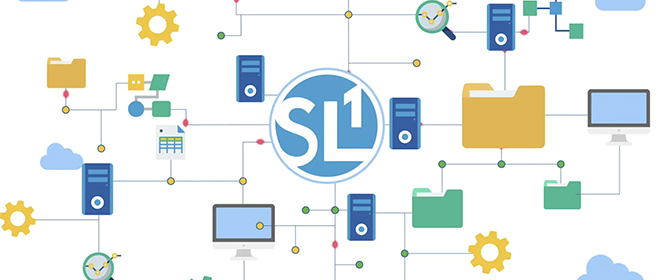
Customer experience has become one of the most important metrics of success. And good customer experiences rely on interconnected technologies, virtual machines, and cloud infrastructures working together to deliver information, transactions, and interactions to your end-user.
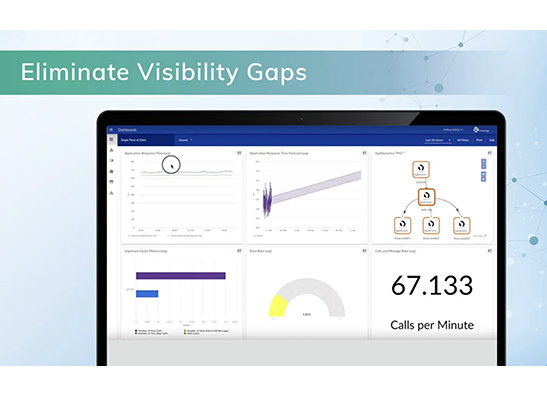
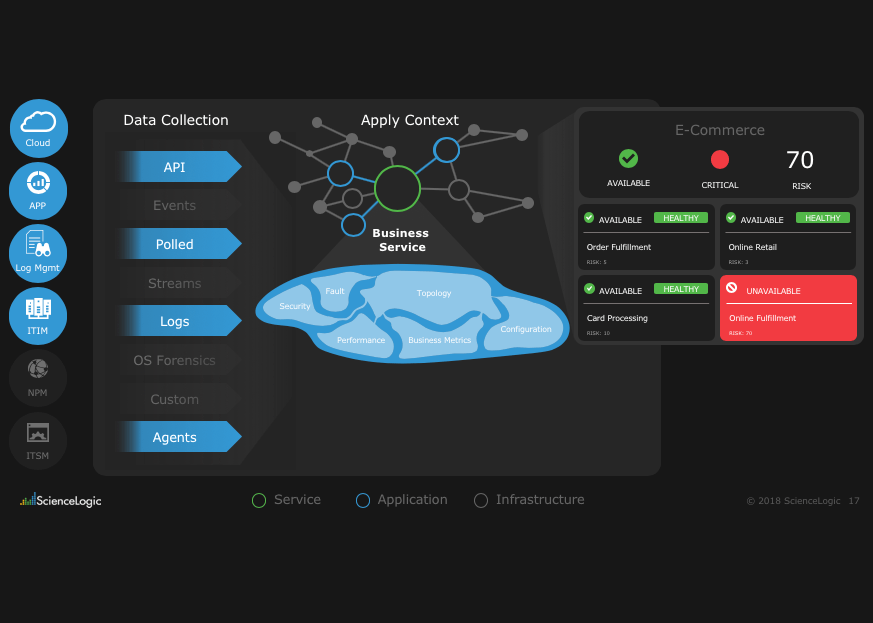
IT infrastructure monitoring provides visibility into these technologies in order to actively diagnose performance and accessibility problems across the entire infrastructure—before an outage that hinders customer experience occurs.
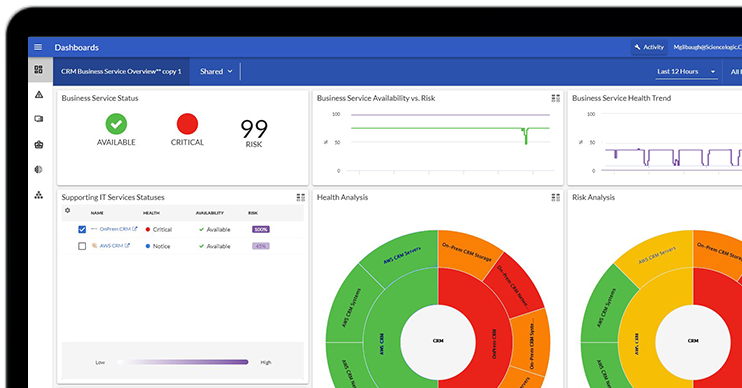
IT infrastructure monitoring, which includes application monitoring, server monitoring, and network performance monitoring, provides you with the ability to see what is happening across your organization’s infrastructure to help teams predict and prevent outages—alerting your team to unplanned downtime, network intrusion, and resource saturation. When you have visibility into your entire infrastructure, the problems IT infrastructure monitoring tools alert you to are solved fast and effectively.
