Strong observability in cloud environments is essential for monitoring the health of interconnected systems. Unlike traditional monitoring, which is limited to specific cloud stacks or devices, observability provides comprehensive visibility across the entire hybrid IT infrastructure including applications, IT systems and services.
This visibility is crucial for viewing the real-time status of technical operations and mitigating incidents—be they cyber or other—to address events before they disrupt service. Observability also plays a significant role in identifying opportunities for cost savings and optimizing cloud resources at a business level. And, strong observability is an important foundational component of flexible IT infrastructures that support streamlined modernization and the implementation of emerging technologies.
Three Components of Observability
To create this holistic view of system health, ITOps teams rely on metrics within three key categories: availability/reliability, performance, and user experience.
Availability and reliability indicators, like uptime, downtime, and incident frequency, provide a snapshot of operations to help ensure systems remain accessible and dependable for business continuity. Performance metrics deliver context on the speed and efficiency of IT systems, which helps IT teams understand and gauge resource utilization and can help identify opportunities for optimization. Finally, user experience (UX) metrics help teams understand how well users interact with IT services, focusing on response times, integration, and overall satisfaction.
Together, metrics from these three categories form a holistic image of how an enterprise’s IT infrastructure is performing and enables IT teams to balance system efficiency with user satisfaction while minimizing downtime.
Availability and Reliability Metrics
Just as the amount of data and new technologies continue to multiply, so do their metrics, meaning there’s no shortage of indicators to keep tabs on. ScienceLogic regularly adds new metrics to its monitoring capabilities to ensure customers never miss a beat.
The several metrics below represent some of the most critical indicators of business service reliability but are far from a complete list of the metrics tracked and monitored by the ScienceLogic AI platform.
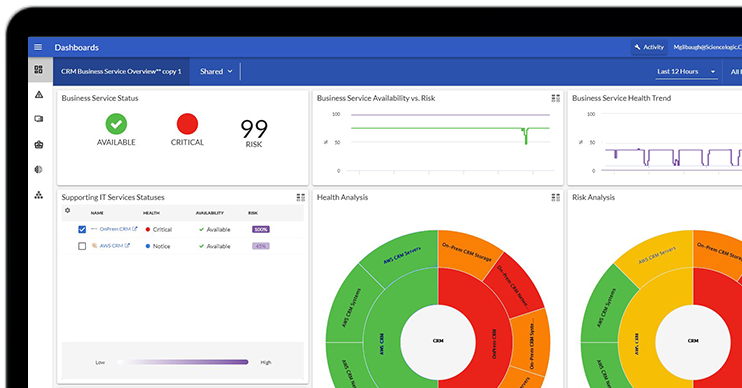
The ScienceLogic AI platform delivers real-time insights into services’ uptime and downtime, enabling customers to view the availability of cloud devices and systems. Monitoring these metrics is critical for ensuring that services are operational and accessible and that business continuity and user satisfaction are assured.
Key indicators include the percentage of time a device or service is operational and able to accept connections. High uptime (99.99%) indicates the device is consistently available, while lower percentages suggest reliability issues. Downtime is when a device or service is not operating and can be planned or unplanned, but the average cost of unplanned downtime can reach up to $5,600 or $9,000 per minute.
- Service Level Agreements (SLAs)
SLAs are crucial for defining the expected performance and availability of IT services provided to customers. SLAs can be monitored through various reports and dashboards that display compliance with defined thresholds and commitments.
SLAs depend on each customers’ operational environment, making real-time monitoring and observability all the more crucial.
- Incident Frequency and Mean Time to Repair (MTTR)
Incident frequency refers to the number of incidents that occur within a specific timeframe. Monitoring this metric helps customers understand the stability of their IT environments and identify patterns or recurring issues that may require attention.
To that end, MTTR measures the average time to diagnose, repair, and restore a failed system or component to full functionality. It is calculated by dividing the total downtime by the number of incidents over a specific period.
The ScienceLogic AI Platform helps customers reduce incident frequency with proactive monitoring to prevent outages. It can significantly reduce MTTR with Skylar Automated Root Cause Analysis, solving issues up to ten times faster than humans alone.
- Vulnerability Scanning Results
Vulnerability scanning results help identify security gaps before exploitation and ensure compliance with industry regulations. Results typically provide an overview of vulnerabilities, their severity, and suggested remediation actions.
For instance, Skylar Advisor can help you stay ahead of vulnerabilities by using AI to deliver critical insights, predictive analytics, and real-time recommendations with step-by-step guidance on how to remediate them.
- Authentication and Authorization Logs
Authentication and authorization logs help IT teams detect and respond to security threats by tracking user login attempts and access, providing insights into who accessed the system, when, and what actions were performed. Logs also shine a light on issues such as user access times or bottlenecks during peak periods.
In the ScienceLogic AI platform, IT administrators can access log details via a centralized interface, analyze events, and establish automated alerts for suspicious activities.
- Compliance and Audit Logs
Compliance and audit logs also help maintain security and adherence to regulatory standards. They’re an essential component of security monitoring and are used to track activities, system changes, and access to sensitive data. Sifting through billions of logs for insights and anomalies needn’t be a time-consuming process. ScienceLogic simplifies compliance by automating auditing and reporting. Users can create and manage log file monitoring policies and maintain audit logs that track user actions, system changes, and compliance violations before they happen.
More Visibility, More Insights
Monitoring key performance metrics like uptime and downtime, Service Level Agreements (SLAs), incident frequency, and Mean Time to Repair (MTTR) is crucial for maintaining system reliability and ensuring quick recovery from issues. Vulnerability scanning results, along with authentication, authorization, and compliance logs, are essential for safeguarding security and meeting regulatory standards.
Together, these metrics provide a comprehensive view of an organization’s IT health, enabling proactive management, enhancing security posture, and ensuring the highest service quality and compliance levels. For any ITOps team, consistently monitoring these metrics is critical to ensure operational success and business continuity.
However, these metrics must also be taken in context with performance and user experience metrics to illustrate the complete picture of an IT environment’s status. We’ll cover the specific metrics for performance and user experience in blogs to come.
Learn more about how the ScienceLogic AI Platform and Skylar suite of AI solutions can help deliver the critical IT context needed to make informed IT decisions and optimize.
Further Reading
Read Part 2
Read Part 3
 See ScienceLogic in actionTake a Tour
 Take Skylar One for a SpinStart Your Test Drive
 The Gartner® Magic Quadrant™ for Observability PlatformsRead the Report
 The Forrester Wave™: AIOps Platforms, Q2 2025Access the Report
 Cut the Noise. Prove the Value. Skylar Advisor.Watch the Recording
