

Eliminate Network Visibility Gaps
Monitor physical, virtual, and software-defined networks (VPNs, routers, switches, firewalls, wireless, etc.)
Automatically collect data via SNMP, API, SSH, Syslog, agent-based, agentless techniques, and more
Integrate and fuse data across modern network and multi-cloud into a real-time, operational data lake
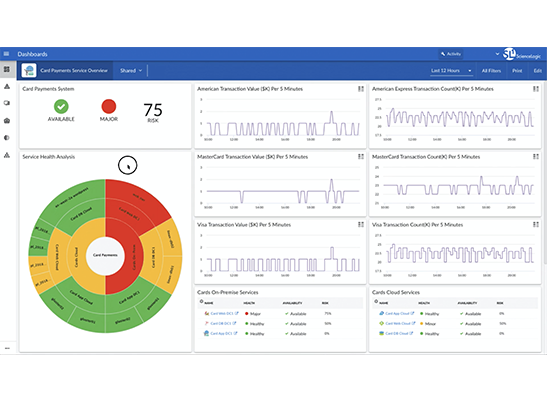
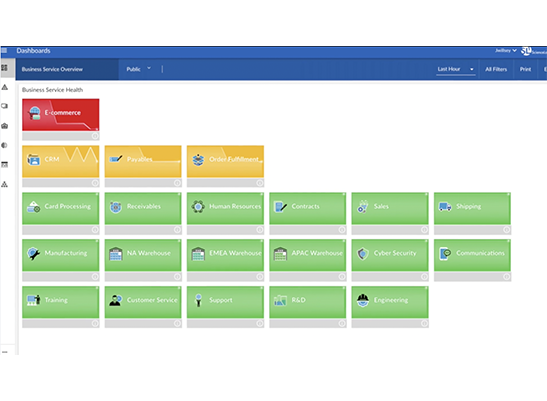
Assess Service Impact to Avoid Service Outages
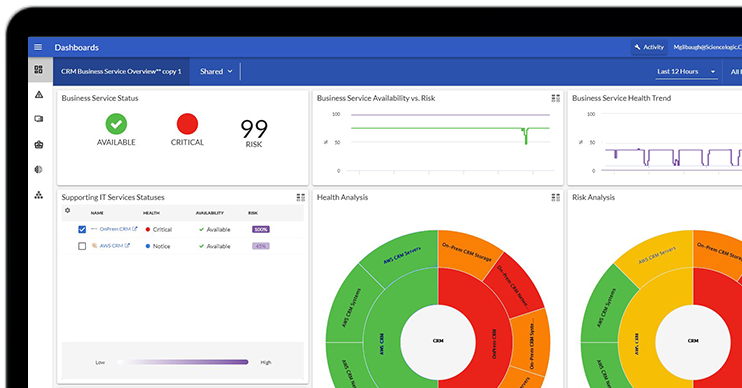
Ensuring optimal service performance in modern networks is complex—shift from device to service-centric observability with Skylar One to proactively avoid service impacting outages.
- Automatically map and track network, app, and service dependencies to understand business impact.
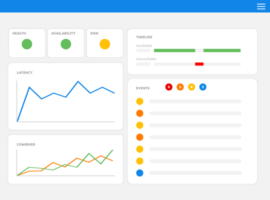
- Measure service health, availability, and risk in a single real-time dashboard.
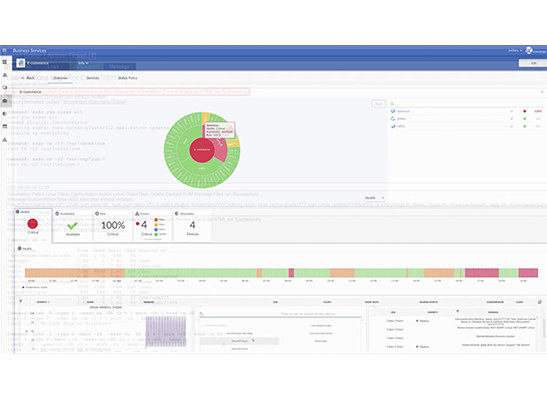
- Prioritize work based on business impact with fast drill down to root cause.
Isolate Root Cause Faster with ML-based Behavioral Correlation
Modern network complexity is outpacing human capacity for analysis and response. Leverage Skylar AI machine learning-based behavioral correlation and anomaly detection to accelerate root-cause analysis.
- Automatically detect weird and anomalous patterns and shapes of performance data.
- Auto-correlate events and anomalies to reduce noise, identify service-impacting issues.
- Quickly assess and isolate the root cause of an issue.
Troubleshoot & Fix Issues Automatically for Faster MTTR
NetOps waste time manually diagnosing and fixing issues using a variety of tools. Accelerate troubleshooting and repair with hundreds of best practice automated actions executed in one platform.
- Automatically capture real-time diagnostic data at the time an event occurs.
- Create and enrich events/incidents with real-time diagnostic information.
- Run recommended triage and remediation actions from within a single command center.

Automate Operational Data Workflows for Performance Insights
Organizations require consistent data across their ecosystem of tools— Skylar One supports a common operating model that powers automated workflows for efficiency and agility across operations and LOB.
- Achieve CMDB accuracy with real-time sync of your monitored environment.
- Resolve incidents faster with automated ticketing.
- Automate CI lifecycle, configuration, change, problem, compliance management, and more.
5 Things to Know About Network Monitoring in a Multi-Cloud World
Success Stories
Hundreds of customers already trust ScienceLogic. Here's why.


Visibility of Mission-Critical Assets
Eliminated 7 legacy tools and visibility gaps to increase visibility from 30% to 100% with single platform

Proactive Incident Response
Real-time visibility and situational awareness of 10,000+ servers across 80+ locations.

What our Customers Are Saying
“We needed a management solution that would support our current level of offerings around network performance such as jitter, latency, and MOS for voice services. Just as important was the ability to support new technologies including servers, storage, and hybrid IT environments using public cloud offerings like AWS and Azure.”
“Skylar One’s continuous monitoring, service visibility, and context-rich incident automation ensures our digital ecosystem is running as it should be, so that our terminal services are more efficient, effective and safer.”
“ScienceLogic is becoming increasingly important to Telstra because of its ability to add scale to the volume of devices that we are involved with. When you are talking about hundreds of 1000s of devices, really there are a limited number of opportunities and platforms available for that end-to-end monitoring.”
“Before Adopting ScienceLogic, NetDesign’s client network was monitored and managed by several disparate tools. Now, 100% of the network infrastructure is monitored by Skylar One. Management is simpler, more comprehensive, and more efficient.”
Get Started Today
Fill out the form to request a customized demo.