


What is IT Infrastructure Monitoring?
Customer experience has become one of the most important metrics of success. And good customer experiences rely on interconnected technologies, virtual machines, and cloud infrastructures working together to deliver information, transactions, and interactions to your end-user.
IT infrastructure monitoring provides visibility into these technologies in order to actively diagnose performance and accessibility problems across the entire infrastructure—before an outage that hinders customer experience occurs.
IT infrastructure monitoring, which includes application monitoring, server monitoring, and network performance monitoring, provides you with the ability to see what is happening across your organization’s infrastructure to help teams predict and prevent outages—alerting your team to unplanned downtime, network intrusion, and resource saturation. When you have visibility into your entire infrastructure, the problems IT infrastructure monitoring tools alert you to are solved fast and effectively.

What are IT Infrastructure Monitoring Best Practices?
- Check your performance metrics regularly.
- Don’t wait for an outage to find out how well your alert system works. Schedule trial runs.
- Understand which alerts are most urgent and prioritize accordingly.
- Automate routine tasks when possible. See AIOps.
- Put support services to work for you when a question or issue arises.
Gain Deep Visibility for Legacy and Cloud Infrastructure
ScienceLogic infrastructure monitoring includes some of the broadest technology coverage in the industry and it can serve as the single source of truth for your IT needs. Beyond networks, servers, and operating systems, our infrastructure monitoring software covers all major public clouds (AWS, Azure, Google, IBM, and Aliyun) as well as multiple virtualization solutions (VMware, Hyper-V, Xen, and KVM), storage arrays, unified communications and videoconferencing, and wireless.
Multiple locations are a challenge for IT to face because it can be difficult to identify and solve problems quickly. With the ScienceLogic infrastructure monitoring solution and its root-cause analysis, you can lessen performance issues quickly and efficiently.
Features & Benefits of ScienceLogic IT Infrastructure Monitoring Tools
What should you be looking for when selecting an IT infrastructure monitoring tool? Here are some key attributes to look for:
A single platform that handles hybrid IT use cases & eliminates the cost and complexity of multiple point tools
Cross-domain visibility network monitoring, server monitoring, application monitoring, virtual machine monitoring, and performance monitoring
More consistent operating processes
Reduced administrative burden on operations teams
Private, segmented views for each operations team (network, UC, server, cloud, etc.)
Ability to share views easily with management, internal and/or external customers
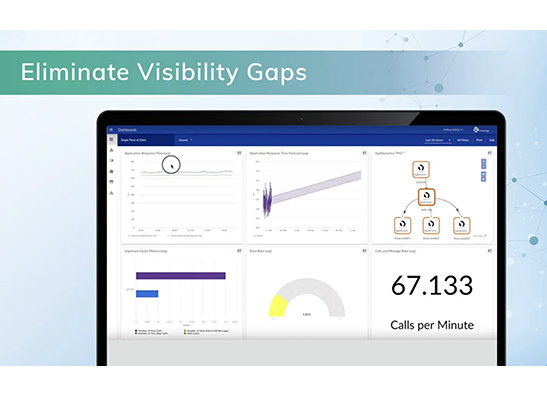
Eliminate Visibility Gaps while Driving Tool Consolidation
Enterprises have significant gaps and overlap in visibility across the data center, cloud, and containers resulting in increased operational costs and conflicting sources of truth.
ScienceLogic monitoring helps consolidate and minimize tools, maximizes cross-domain visibility, overall performance monitoring, and reduces the total cost of ownership with a single platform.
SL1 Integrations
With 500+ integrations known as PowerPacks, spanning over 100 vendors and thousands of device types, ScienceLogic has pre-built PowerPacks for most of the commonly deployed devices and technologies that any customer would need to monitor.
Public and Private Cloud Services
In a multi-cloud environment, your business only performs as well as what you can see.

Virtual and Physical Servers and Operating Systems
Get actionable insights and comprehensive data center visibility into all of your server infrastructures.

Unified Communications VOIP Systems
Ensure performance across your organization – keep your systems and services up and running and your users connected.

Wireless LAN Systems
Gain visibility of Wireless LAN components – reduce MTTR with rapid triage of problems.

Networks
View the performance of your physical & SDN infrastructure – see every network resource, everywhere.

Storage Systems
Confidently invest in the latest technologies without losing management visibility – do more with your storage.
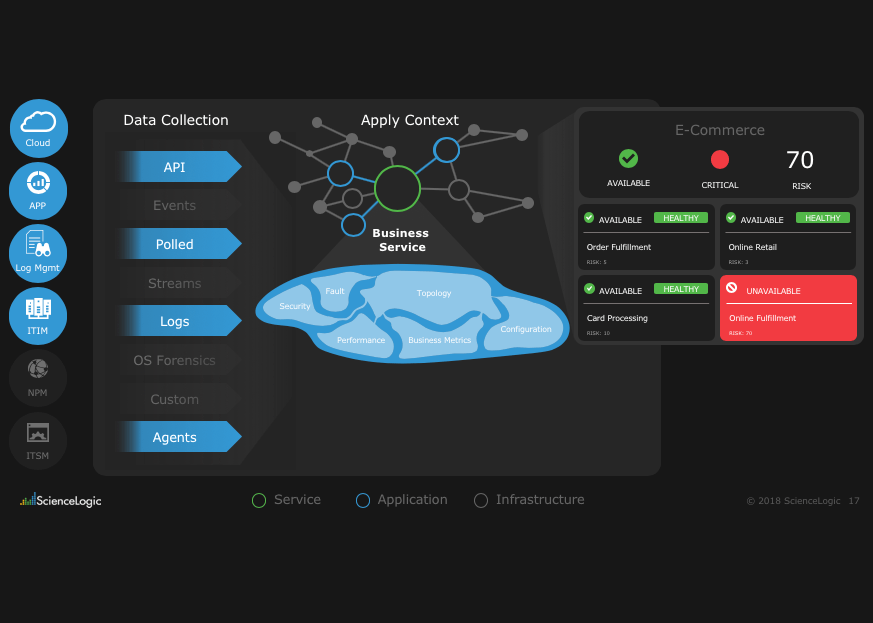
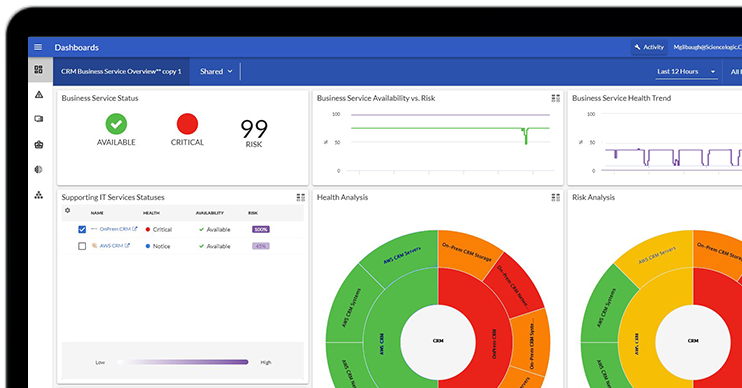
Holistic IT Monitoring for Enhanced Business Services
ScienceLogic Business Service functionality groups devices into service-related views and monitors them as a holistic system – while also mapping applications to their underlying IT infrastructure. Newly enhanced Business Services include:
- Application monitoring & visibility – see how infrastructure affects application performance
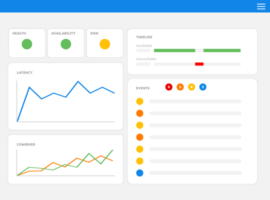
- Business Service dashboard views
- Incident management, enrichment, and automation via integration with ServiceNow
Gain real-time context for how everything – infrastructure, apps, data, virtual machines, and business services–works together.
Top Reasons for ScienceLogic Hybrid Cloud Business Service Monitoring
Success Stories
Hundreds of customers already trust ScienceLogic. Here's why.


Workhorse for IT Operations
Sl1 ensures the health, availability, and reliability behind every service, application, and device