How to Reduce MTTR by Automating Incident Troubleshooting
In my last blog, I highlighted incident response as a candidate for automation for ITOps. In this post, I’ll look at how the troubleshooting process can be automated to help reduce incident MTTR.
Benjamin Leyland, Principal Solutions Architect, ScienceLogic
What do your Tier 1 Engineers do when they respond to an incident in your IT infrastructure and applications? Even with a well-defined incident management process, engineers still have a lot of legwork to do basic triage: finding device credentials, jumping through networking hoops to connect to the affected device, looking up the appropriate commands to run, and then copying and pasting it all into the incident.
This type of repetitive task is a prime candidate for automation. By automating the collection of diagnostic data, you can free up your engineers to do what humans are great at: diagnosing the root cause of a problem. A secondary benefit is that the automation can run immediately and not wait for human intervention. This can provide critical information about transient issues that might no longer be active when human triage begins. What’s more, the automation eliminates the time delays required for a human to perform tasks in a serial fashion or wait on responses from colleagues performing some of the tasks.
There is certain information that an engineer needs to see for most events, such as the affected device, the threshold that was not met, and the impacted services or customers. Platforms like SL1 already have this built-in to their event data model, visible in the event console, and ready to push to an external incident management system if necessary. But engineers need different data for different types of events, data that is collected in various ways for different devices. So, what’s the path to getting contextual diagnostic data that is relevant to the specific problem at hand?
How to Plan an Automated Troubleshooting Implementation
Identify the types of events for which you want to automate troubleshooting and the types of devices they occur on. There are numerous event/device combinations, so choose an initial set that’s appropriate for your organization, i.e. the events you deal with most in your environment.
Determine how you’re going to collect data. This will vary for different devices and datasets but will typically be via common protocols that enable you to reuse collection frameworks.
Plan how you will manage access to the diagnostic data, including the storage of credentials from each device or system from which you’ll collect data.
Decide where users will access the diagnostic data, e.g. will it be sent in a notification email? Viewed through the event console in SL1? Included in a note in the incident ticket?
There are two main pieces of data that define what diagnostic commands need to be executed for a given incident and how the results are collected: the type of event and the type of device it occurs on, e.g. a file system over threshold event on a Linux device. In this example, an engineer would likely run multiple variations of the “find” command to get a list of the largest files and directories on the affected file system. The same type of event on a different device, e.g. a Windows server, requires a different set of commands and a different method of collection.
The list of diagnostic data that needs to be collected will often inform the choice of how to collect that data. For the Linux file system example, the chosen method to get a list of largest files will typically be via SSH. This will waterfall down to credential management; the type of access required to collect diagnostic data might be different from those used for monitoring. For example, most hardware route/switch devices expose monitoring data via SNMP but require an SSH connection to get detailed configuration and run diagnostic commands like ping.
A mapping of devices and events to lists of commands is the basis of an automated troubleshooting configuration. Ideally, the framework code that performs diagnostic collection takes device data, event data, and command data as input and can be reused for any combination of the three for a given protocol. For example, the same SSH collection framework should be flexible enough to collect file system diagnostics from CentOS and memory diagnostics from Ubuntu.
So how is this implemented in SL1? The runbook automation feature includes three elements that enable this type of code reuse:
1.Action Types
An action type defines two things:
A snippet of code that can run in the SL1 automation framework
A set of input variables
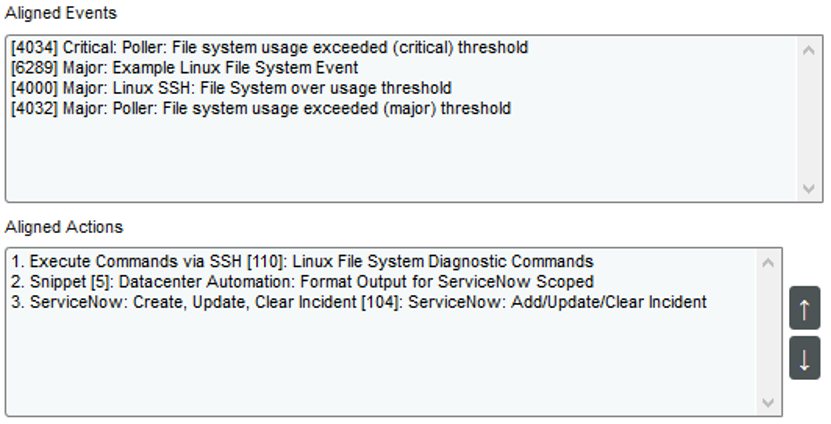
For example, the “Execute Commands via SSH” action type takes a list of commands as one of its inputs. All action types take a default set of inputs, including the event record that triggered the automation and associated device.
2. Automation Actions
An automation action is a saved set of parameters for a particular action type. For example, the “Linux File System Diagnostic Commands” automation action specifies a set of inputs to the “Execute Commands via SSH” action type. All the different combinations of diagnostic commands that need to be collected via SSH are implemented as different actions that share the same action type. With this additional layer of abstraction, adding or tweaking automations for an existing technology can be done through configuration rather than coding.
3. Automation Policies
An automation policy defines when one or more automation actions will be executed. An automation policy can be run automatically when events meet specific criteria, on-demand at the request of a user, or on a schedule. For automated troubleshooting, policies are executed automatically when events of a specific type (i.e. from a specific event policy) occur on a specific set of devices (e.g. all Linux devices). The separation of policies from actions allows for the same actions to be re-used across multiple policies.
ScienceLogic has a range of automation PowerPacks that contain pre-packaged Action Types, Automation Actions, and Automation Policies. For example, the Linux SSH Automation PowerPack includes all the content for the examples in this post. This allows you to jump-start this process for common technologies and events.
To make it easier for users to view diagnostic data in their preferred format, ScienceLogic Automation PowerPacks leverage the ability to chain multiple automation actions together in a single automation policy. Each pre-packaged automation policy includes two actions: one to collect data and one to format the data as HTML for display in the SL1 event console.
Without changing the collection mechanism, the data can be routed to an incident management system like ServiceNow by switching the formatting action and adding the connector to ServiceNow:
This type of flexibility is key to implementing automation. Based on your operational procedures, your organization might need to customize the list of events, the list of commands, or the output destination. Getting your automated troubleshooting solution right is not just going to lower MTTR, it will set you up to start optimizing and automating incident remediation too.