

Today’s hybrid cloud environments continue to grow more diverse, distributed, and dynamic. While technological advances offer greater agility and new capabilities, they also present your IT operations (ITOps) teams with unprecedented levels of complexity—especially when it comes to resolving issues that disrupt business services and mitigate the gains promised by the move to the cloud.
Monitoring and observability tools should offer some help, providing insight into the health of systems and the root cause of issues. But too many teams are stuck with outdated monitoring tools, disparate observability solutions from different vendors, or loosely integrated product suites that only offer limited visibility.
ScienceLogic can help. By combining monitoring and observability solutions on a single, comprehensive platform, we help ITOps break free of the obstacles and efficiencies caused by point tools and inadequate product suites. Working with our unified SL1 platform, you can achieve dramatic improvements in speed and agility to improve customer experiences, contain costs, and confidently adopt new technologies that deliver greater agility for your business.
Monitoring, observability and AIOps: understanding the differences
Every device, service, and application in your IT ecosystem generates a continuous stream of performance data that can help ITOps keep everything running smoothly. Monitoring and observability tools are designed to harness this stream of real-time telemetry, providing insight into what is happening across your IT estate—and why.
Monitoring and observability play important but different roles in managing and enhancing IT performance.
- Monitoring tools visualize and track what is happening across an IT environment in real-time, alert your teams to trouble in outages, and provide a moment-to-moment view of the health of your IT operations. By collecting logs and metrics from your systems, monitoring solutions let you know when a system isn’t working.
- Observability provides a deeper understanding of the “why” behind performance issues. Observability solutions infer the internal state of the system based on externally visible symptoms, and analyze data from logs, metrics, and traces to swiftly determine the root cause of issues. Delivering complete visibility, observability tools help enhance digital infrastructures to improve employee productivity and deliver exceptional customer experiences.
To put it simply, monitoring lets your ITOps teams know when a system isn’t working, and observability let them ask why it isn’t functioning. Both monitoring and observability are essential capabilities.
AIOps combines traditional monitoring and observability with automation, opening the door to more advanced capabilities like autonomous operations that enable self-healing and preventative maintenance. AIOps applies advanced analytics, machine learning (ML), and artificial intelligence (AI) to automate operations so that ITOps teams can move at the speed your business demands.
Monitoring and observability with ScienceLogic
The ScienceLogic AI Platform combines monitoring and observability functions into a platform that unlocks the power of AIOps. As in all-in-one, flexible observability and AIOps platform, ScienceLogic accelerates digital business, boosts IT productivity, and delivers resilient digital experiences for users and customers.
With monitoring and observability tools, your ITOps teams can:
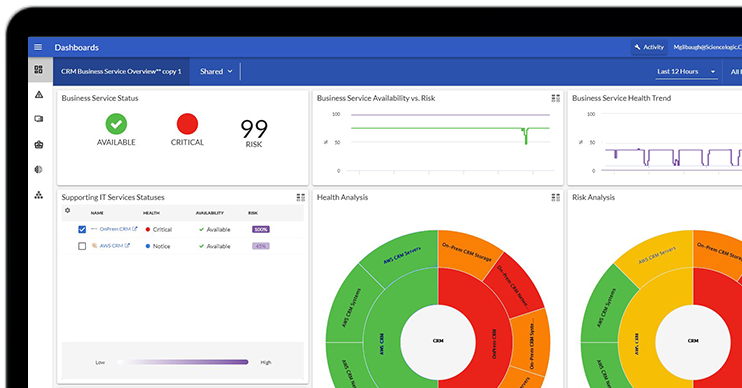
- See all your data in one place. SL1, part of the ScienceLogic AI Platform, discovers all the components within your IT estate and gathers data across all environments to establish a real-time operational data lake. The platform’s modern, scalable microservices-based architecture supports the high-volume, transaction-intensive environments of the most demanding service providers and enterprises.
- Gain actionable insights with AI/ML tools. SL1 detects anomalies and correlates them with common events within a service context, cutting through the noise to quickly establish the root cause of an issue. Because SL1 can sift through massive volumes of data quickly, it can rapidly identify service-impacting issues when they occur and uncover root causes in a few mouse clicks.
- Automate IT workflows. SL1 integrates and shares data across technologies throughout the IT ecosystem in real time. Multi-directional integrations automate both responsive and proactive actions at cloud scale. For instance, ScienceLogic’s platform makes it easy to keep your CMDB up-to-date and accurate, to automate ticketing and routing, and to automate entire troubleshooting and remediation workflows.
Additional monitoring and observability solutions
In addition to SL1, ScienceLogic offers a tool for automatically identifying root causes. ScienceLogic Skylar Automated RCA AI Log Analysis ingests and runs ML-driven log analysis across millions or billions of messages from log files to quickly identify and fix service-impacting incidents.
Why choose ScienceLogic?
ScienceLogic is trusted by thousands of organizations in every industry to deliver insights that accelerate innovation and drive business outcomes. The ScienceLogic AI Platform monitors an organization’s digital footprint wherever it resides, using patented discovery techniques to reveal everything within an IT environment. Combining technologies for AIOps, IT infrastructure monitoring, and observability with software for network management and network automation, ScienceLogic facilitates automated IT operations that can fix problems faster while freeing up time and resources for ITOps teams.
The ScienceLogic AI Platform is proven for scale by the world’s largest service providers, optimized for the needs of large enterprises, and tested against the rigorous security requirements of the United States Department of Defense. With ScienceLogic, organizations can manage IT environments at speed, at scale, and in real-time.
Monitoring and Observability FAQs
What is IT infrastructure monitoring?
IT infrastructure monitoring provides visibility into modern IT technologies to help diagnose performance issues before outages impact customer experiences. IT infrastructure monitoring tools continuously observe and track the performance, availability, and overall health of an IT environment.
What is observability?
Observability extends beyond traditional monitoring to provide insight into the internal states of systems based on the data it produces. Observability monitoring enables more effective troubleshooting, root cause analysis, and performance optimization.
What is AIOps?
AIOps automates and enhances IT operations with AI and ML capabilities. It automates incident response, improves anomaly detection, manages predictive analysis, and reduces noise from alerts and monitoring technology.
What is telemetry?
Telemetry is the process of automatically collecting, transmitting, and analyzing data from remote sources to monitor and manage systems. OpenTelemetry is an open-source project that provides a set of APIs, agents, libraries, and instrumentation that facilitate the collection, processing, and export of performance data for applications and infrastructure.