


As IT environments grow more complex, IT teams are increasingly turning to observability to maintain system health and resolve incidents quickly. In contrast to traditional IT infrastructure monitoring which lets teams know when something is going wrong, observability is meant to provide insight into why things aren’t working and how to fix them. With tools for both observability and monitoring, IT teams should be able to detect and remediate issues more effectively.
In reality, most solutions rarely fulfill the promise of observability. Monitoring and observability solutions allow you to collect and centralize data effectively, and the latest tools can even keep up with the speed of data growth in IT environments. However, as the scale, complexity, and speed of change in IT systems increases exponentially, observability/monitoring tools must rely on human IT specialists to know what to look for or where to start searching when issues arise. The bottleneck for incident resolution is now the human brain – which cannot keep pace with the rapid evolution of digital environments.
ScienceLogic can help. The ScienceLogic AI Platform offers monitoring and observability tools that feature machine learning-driven automated IT root cause analysis. With ScienceLogic’s observability/monitoring capabilities, you can see everything in your complex hybrid environment, maintain the health of critical systems, and take the next steps in the journey to autonomous IT.
How to fulfill the promise of observability solutions
Traditional observability solutions are unable to easily pinpoint what is wrong inside an IT system. Since humans can’t keep up with the rapid growth of IT complexity, scale, and speed, observability technology must rely on automated root cause analysis and automated IT workflows to truly reap the benefits of observability.
Accelerating root cause analysis with ML
Effective hybrid cloud observability solutions must perform the same tasks that an experienced, highly skilled IT troubleshooter does—but with much greater speed and accuracy. To achieve this, observability/monitoring technology can use machine learning to analyze metrics that reveal when a problem happened and use traces to narrow down which parts of the system were affected. Then, by reviewing log events, an automated observability tool correlates the issue with unusual events and downstream errors to analyze root cause.
Automating workflows to improve observability
To truly achieve the promise of observability, monitoring solutions must become automated, minimizing the role of human IT teams to achieve even faster speeds. The best solutions use AI-driven automation to collect telemetry from key systems, delivering visibility into every component that could impact business services. To contextualize this data, observability tools must automatically catch unusual events, outliers, and anomalies and identify correlations between them. Then, after automatically determining root cause, an observability tool should allow you to automate corrective actions in many or most cases, using run book automations or automated workflows.
By effectively leveraging machine learning (ML) automation, a superior solution turns full stack observability into a self-healing system that minimizes mean time to repair (MTTR) while freeing up IT teams and resources.
Observability and monitoring with ScienceLogic
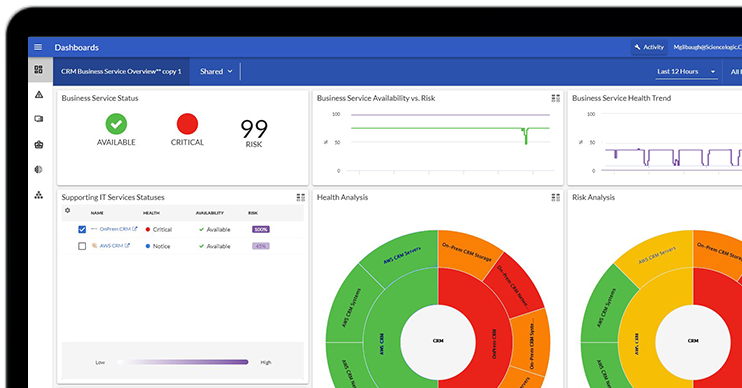
SL1, part of the ScienceLogic AI Platform offers some of the richest automation capabilities in the market today, helping ITOps teams to better understand their business services in highly distributed IT environments.
With ScienceLogic’s observability/monitoring tools, ITOps teams can:
- See everything. After using a variety of techniques to discover all the devices within an IT ecosystem, SL1 builds a real-time operational data lake by collecting and normalizing performance data, configuration details, logs, relationships, and metadata. SL1 connects the dots on dependencies between legacy and modern technology with cross-domain infrastructure, application, and service topology maps. ITOps teams can then build queries, generate reports, and configure unified dashboard views to gain actionable insights.
- Contextualize data: SL1 helps organizations shift from device-centric to service-centric observability, monitoring the business impact of IT incidents and identifying what parts of the business are at risk. ML-driven anomaly detection helps find previously unseen problems, enabling ITOps teams to take action before issues occur. Human-ready AIN sites enable teams to quickly resolve the root cause of issues.
- Automate IT workflows: SL1 automates incident resolution and routine IT processes like ticketing, notification, collaboration, and service request fulfillment. It also synchronizes data flows and workflows across the IT ecosystem with pre-belt and easily customizable integrations. With rich, contextualized intelligence, SL1 powers multi-directional workflows at scale for both proactive and responsive actions.
Automated root cause analysis with ScienceLogic’s Skylar Automated RCA
Skylar Automated RCA builds on the capabilities of SL1 to deliver highly accurate, automated root cause analysis.
Skylar Automated RCA ingests logs and applies machine learning to millions or billions of messages from log files across applications and infrastructure. By automatically analyzing relevant logs in real time, Skylar Automated RCA detects unusual behavior and identifies root cause, generating both visual reports and plain language summaries. Rather than painstakingly sifting through numerous logs in search of problems, ITOps teams can rely on Skylar Automated RCA to better understand their complex cloud-native modern applications and business services.
With Skylar Automated RCA, ITOps teams can:
- Diagnose issues 10x faster by eliminating much of the manual work required to review logs.
- Minimize IT burden – Skylar Automated RCA requires no manual training, and unsupervised machine learning produces results in less than 24 hours.
- Identify unusual or novel issues and their root causes, even when teams and observability/monitoring tools don’t know what to look for.
- Simplify log analysis with plain language summaries and visual word cloud reports that distill billions of log lines down to the few most salient data points.
Why ScienceLogic?
ScienceLogic is a leader in observability, monitoring, and AIOps, providing modern IT operations with actionable insights that help to predict and resolve problems faster in a digital, ephemeral world. By empowering intelligent, automated IT operations, ScienceLogic empowers organizations to manage IT environments at speed, at scale, and in real time.
With ScienceLogic, customers get:
- Battle-tested technology: ScienceLogic’s technology meets the rigorous security requirements of the United States Department of Defense. It has been proven for scale by the world’s largest service providers and optimized for the needs of large enterprises in many industries.
- Broad applicability: ScienceLogic provides accurate, trusted, and cost-effective, analytics-driven automation that supports a broad array of use cases.
- Expanding partnerships: ScienceLogic strategically collaborates with MSPs, global system integrators, the federal system integrators, and channel partners to streamline hybrid cloud complexity and digital transformation.
- An industry-recognized solution: ScienceLogic was named among the top three vendors in The Forrester Wave™: Artificial Intelligence for IT Operations (AIOps), Q4 2022 report, achieving the highest possible scores.
Observability and Monitoring FAQs
What is observability and monitoring?
In IT, observability is the practice of understanding a system’s internal state by analyzing external outputs like metrics, logs, and traces, providing insights into performance and behavior. Monitoring involves tracking specific metrics and system states to ensure components are operating correctly and generating alerts when predefined thresholds are breached. While monitoring helps detect when something goes wrong, observability helps diagnose why and how to fix it.
What is telemetry and open telemetry?
Telemetry is the automated process of collecting, transmitting, and analyzing data from remote sources to monitor and manage the performance and health of systems. Open Telemetry, or OpenTelemetry, is an open-source project that provides standardized tools, APIs, and libraries for collecting telemetry data, including metrics, logs, and traces, from applications and infrastructure. It enables comprehensive observability by ensuring consistent data collection and interoperability across different monitoring and observability tools.
What is autonomic IT?
Autonomic IT refers to self-managing computing systems that can automatically configure, optimize, heal, and protect themselves without human intervention. Inspired by the autonomic nervous system in the human body, these systems use advanced algorithms and artificial intelligence to detect issues, perform routine tasks, and adapt to changing conditions. The goal of autonomic IT is to reduce the complexity and manual effort required for IT management, improving efficiency and reliability.