

IT operations teams today face tremendous challenges when seeking to maintain the health of systems and resolve incidents quickly. Traditional IT infrastructure monitoring tools have become inadequate and obsolete as IT environments grow increasingly distributed, dynamic, and complex. Observability solutions have emerged as a more effective approach to gaining insight into why systems aren’t working and how they can be fixed.
For many ITOps teams implementing observability technology, OpenTelemetry has become an important tool for collecting and exporting telemetry data from applications. OpenTelemetry is an open-source framework and toolkit designed to manage telemetry data including traces, logs, and metrics. Importantly, OpenTelemetry is vendor- and tool-agnostic, allowing integration with a broad variety of observability platforms.
As a leader in IT operations management, ScienceLogic provides observability solutions that integrate seamlessly with OpenTelemetry. By leveraging the OpenTelemetry standardized framework for collecting, processing, and exporting telemetry data, ScienceLogic enables ITOps teams to gain comprehensive visibility into digital ecosystems, monitor environments end to end, enhance event correlation with rich context, and rely on early detection and automated responses to address incidents.
The OpenTelemetry framework
As an observability framework, OpenTelemetry is focused on the generation, collection, management, and export of operational telemetry data. The framework is designed to allow ITOps teams to easily instrument applications or systems regardless of language, infrastructure, or runtime environment. Storage and visualization of telemetry data is left to other tools.
With today’s increased reliance on cloud computing, microservices, and highly distributed environments, observability solutions are more important than ever. Observability is the ability to understand the internal state of the system by reviewing its outputs. In IT environments and applications, full-stack observability enables ITOps teams to understand the health of systems through a digital ecosystem by examining their telemetry data.
Data collected by OpenTelemetry includes logs and metrics.
- Logs are time-stamped records of discrete events that occur within an application, system, or network. They provide detailed information about what happened at a specific point in time, often including contextual data such as error messages, user actions, and system states.
- Metrics are numerical data points that represent the state or performance of a system over time. They are typically aggregated and measured at regular intervals to provide insights into trends and patterns.
OpenTelemetry enables ITOps teams to streamline collection of this observability data. Importantly, the framework prevents vendor lock-in by ensuring that organizations retain and own the data generated. The OpenTelemetry framework also simplifies observability by requiring ITOps teams to only learn a single set of APIs and conventions.
OpenTelemetry and ScienceLogic
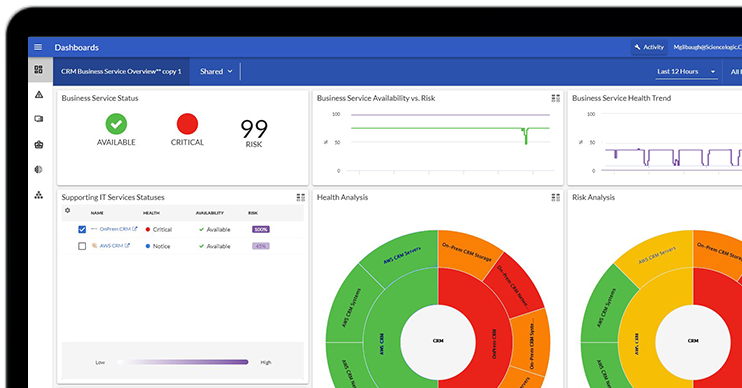
The ScienceLogic AI Platform monitors a customer’s digital footprint wherever it resides, improving visibility and availability of business services across the organization. Using patented discovery techniques, ScienceLogic finds everything within your IT environment, offering visibility across technologies, vendors, data centers, and clouds.
Through integration with OpenTelemetry, ScienceLogic enables your ITOps teams to:
- See all your data in one place. SL1, part of the ScienceLogic AI Platform integrates with OpenTelemetry and collects data from a wide range of sources across hybrid and multi-cloud environments. After discovering all the components within your enterprise across physical, virtual, and cloud environments, SL1 fuses data in a clean and normalized data lake.
- Contextualize data. Analyzing and acting on data at cloud scale, SL1 applies a rich set of analytical techniques and adds business service context and meaning to telemetry data. Using context to cut through the noise, SL1 helps quickly establish the impact and root cause of an issue.
- Automate workflows. By integrating and sharing data across technologies, SL1 enables multi-directional integrations to automate responsive and proactive actions at cloud scale. ITOps teams can automate ticketing, troubleshooting, and configuration updates to the CMDB to accelerate incident resolution.
Automating root cause analysis with OpenTelemetry data
While OpenTelemetry provides data that can help with root cause analysis, the complexity of modern IT environments produces so much data that ITOps teams can’t possibly keep up. That’s where automated root cause analysis with Skylar Automated Root Cause Analysis (RCA) can help.
Skylar Automated RCA does the heavy lifting when critical business services go down, automatically ingesting and running machine learning (ML) log analysis across millions or billions of messages from log files.
With Skylar Automated RCA, ITOps teams can:
- Process enormous volumes of log messages in real time to identify root cause 10x faster.
- Eliminate much of the manual work involved in diagnosing root cause from logs.
- Minimize time to understand what is actually broken with summaries and recommendations provided by GenAI.
- Spot new problems without manually building complex rules for scrolling through log data.
- Detect unusual or novel issues and associated root causes, even when ITOps teams don’t know what to tell monitoring tools to look for.
- Correlate unusual behavior with recent changes in performance metrics to gain insight into the potential business or service impact.
- Distill billions of log lines down to the few most critical to isolate root cause.
- Visualize the most important keywords from logs that describe the root cause.
Why ScienceLogic?
Offering solutions for AIOps, AI observability, monitoring, and network management, ScienceLogic provides modern IT operations with actionable insights that help to predict and resolve problems faster in a digital, ephemeral world. By enabling intelligent, automated IT operations, ScienceLogic empowers organizations to manage IT environments at speed, at scale, and in real time.
With ScienceLogic, customers get:
- A well-known platform: ScienceLogic was named among the top three vendors in The Forrester Wave™: Artificial Intelligence for IT Operations (AIOps), Q4 2022 report, achieving the highest possible scores.
- An extensible solution: ScienceLogic provides accurate, trusted, and cost-effective, analytics-driven automation that supports a broad array of use cases.
- Tested technology: ScienceLogic’s technology meets the rigorous security requirements of the United States Department of Defense. It has been proven for scale by the world’s largest service providers and optimized for the needs of large enterprises in many industries.
- Essential partnerships: ScienceLogic strategically collaborates with MSPs, global system integrators, the federal system integrators, and channel partners to streamline hybrid cloud complexity and digital transformation.
OpenTelemetry FAQs
What is OpenTelemetry?
OpenTelemetry is an open-source observability framework that combines tools, APIs, and SDKs for collecting, processing, and exporting telemetry data such as metrics, logs, and traces. By standardizing the way telemetry data is gathered and used, it makes it easier for ITOps teams to monitor and understand the performance of their applications and systems.
What is AIOps?
AIOps, or artificial intelligence for IT operations, uses artificial intelligence (AI), machine learning (ML), and big data analysis to enhance and automate the work of IT operations teams (ITOps). AIOps solutions improve the efficiency and effectiveness of ITOps teams by automating tasks, accelerating incident detection and response, and automating root-cause analysis.
What is full-stack observability?
Full-stack observability is a comprehensive approach to monitoring and analyzing the performance, health, and behavior of an entire IT stack, encompassing all components from the infrastructure layer to the application layer and everything in between. This holistic view is designed to deliver visibility into every aspect of the system, ensuring that IT teams can detect, diagnose, and resolve issues efficiently, and optimize overall performance.
What is AI observability?
AI observability, or artificial intelligence observability, uses artificial intelligence and machine learning techniques to enhance the monitoring, analysis, and management of IT systems and applications. This approach leverages AI to provide deeper insights, automate anomaly detection, and predict potential issues in complex, dynamic environments.