
IT infrastructure has never been more complicated. Hybrid cloud environments continue to grow more diverse, distributed, and dynamic, requiring ITOps teams to manage a workload-intensive mix of legacy and modern applications and infrastructure. Traditional monitoring tools seem powerless to keep pace with the velocity, volume, and variety of data, leaving IT teams unable to quickly identify and remediate root causes when things go wrong.
Full-stack observability offers a way out of this wilderness. Full-stack observability solutions give your IT teams the real-time status of each component within your technology stacks. This enables a thorough understanding of highly distributed application topologies and dependencies across all domains. With a holistic view of your IT ecosystem—including cloud-hosted applications, infrastructure, services, on-premises servers, Kubernetes infrastructure, and other cloud-based assets—your ITOps teams can easily manage vast amounts of data and correlate application performance to business outcomes.
As a leader in AIOps and IT operations management, ScienceLogic provides powerful capabilities for full-stack observability. With the ScienceLogic AI Platform and ScienceLogic’s Skylar Automated RCA, your teams get comprehensive, real-time insight into the behavior, performance, and health of your applications and infrastructure.
What is full-stack observability?
Observability is the ability to understand the internal state of an IT system based on external indicators like the data it produces. Observability solutions collect, analyze, and visualize data—including metrics, logs, and traces—to detect issues early, perform IT root cause analysis, and resolve issues that impact business services.
Full-stack observability monitors and analyzes operational telemetry from all layers of an IT stack to provide a holistic view of system performance, health, and behavior. Full-stack observability solutions monitor key layers of IT environments, including:
- Front-end experiences: Monitoring end-user interactions with web or mobile applications, including page load times, user engagement, and error rates.
- Backend services: Observing the performance and behavior of backend applications and services, such as APIs, databases, and microservices.
- Application layer: Tracking the performance and health of the application code, including response times, error rates, and transaction tracing.
- Infrastructure: Monitoring the underlying infrastructure that supports the applications, including servers, virtual machines, containers, and network devices.
- Network: Analyzing the network performance and connectivity between different components and services.
- Security: Ensuring security practices and compliance across all layers, detecting vulnerabilities, and monitoring for potential security threats.
Insights gleaned from full-stack observability solutions enable IT teams to:
- Pinpoint precise root cause and prioritize issues based on their impact on business services.
- Eliminate operational silos and improve connections between IT teams.
- Proactively identify and resolve incidents before they affect performance.
- Gain end-to-end visibility across multi-cloud ecosystems.
- Align tech decisions with business needs using precise analytics.
- Align runtime application security with DevSec.
- Automate and accelerate the CI/CD pipeline.
- Optimize IT infrastructure cost and performance.
Full-stack observability tools must integrate easily with existing software, support modern event-handling techniques, and provide instant context for IT environments. Superior solutions will offer seamless and user-friendly insights, supply ITOps teams with data in real time, and use machine learning to automate processes and curation.
That’s exactly where ScienceLogic excels.
Full-stack observability with ScienceLogic
ScienceLogic enables your ITOps teams to realize all the benefits of full-stack observability. The ScienceLogic AI Platform sees everything across multi-cloud and distributed architecture and uses relationship mapping to contextualize data. Insights can be easily integrated and shared across technologies within your IT ecosystem in real time, enabling teams to apply multi-directional integrations that automate both responsive and proactive actions at cloud scale.
See all your data in one place
SL1 uses a variety of techniques to discover devices and to collect performance data, configuration details, relationships, logs, and metadata. After aligning, merging, aggregating, de-duping, and normalizing data, SL1 fuses it into an operational data lake. This allows your ITOps teams to create queries, generate reports, and build unified dashboard views to gain actionable insights.
Contextualize data with AI/ML insights
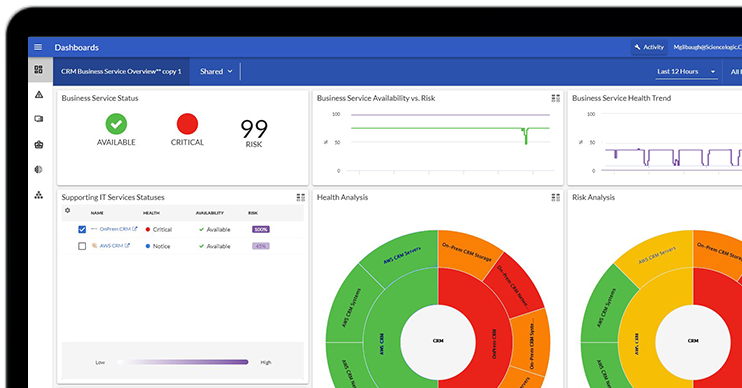
ScienceLogic gives your teams the flexibility to visualize the health, availability, and risk of your business services. A rich set of analytical techniques employs machine learning to detect weird or anomalous service behavior and correlate it with common events within a service context. This allows the platform to cut through the noise and quickly establish the root cause of an issue.
Connect your IT ecosystem
Harnessing rich, contextualized intelligence, ScienceLogic powers multi- directional workflows at scale. IT ops teams can keep the CMDB up-to-date and accurate, automate ticketing and routing, and automate troubleshooting and remediation workflows. The platform offers an extensive library of pre-built automation actions with numerous triage best practices and remediation actions.
Automated root cause analysis with ScienceLogic’s Skylar Automated RCA
ScienceLogic’s Skylar Automated RCA enhances the full-stack observability capabilities of the ScienceLogic AI Platform by automatically identifying the root cause of issues. Skylar Automated RCA automatically ingests and runs machine learning log analysis across millions or billions of messages from log files. By processing enormous volumes of log messages in real time, Skylar Automated RCA can diagnose issues 10x faster with automated root cause analysis.
With Skylar Automated RCA, you can:
- Reduce time to understand what is broken.
- Gain guidance on where to begin troubleshooting and repair.
- Identify unusual issues and associated root causes – even when your monitoring tool doesn’t know what to look for.
- Correlate unusual behavior with recent changes in performance metrics to see the potential impact on business and services.
- Get plain language root cause summaries based on a natural language model with generative AI that understands your operations and environment.
Why choose ScienceLogic?
ScienceLogic offers actionable insights that empower intelligent, automated IT operations and help teams to predict and resolve problems faster in a digital, ephemeral world. The ScienceLogic platform combines multiple tools for AIOps, monitoring and observability, and network automation to automate IT operations, free up time and resources, and drive business outcomes.
Trusted by thousands of organizations, ScienceLogic technology was designed for the rigorous security requirements of the United States Department of Defense. The ScienceLogic AI Platform has been proven for scale by the world’s largest service providers and optimized for the needs of leading enterprises. With ScienceLogic and AIOps, businesses can manage IT environments at speed, at scale, and in real time.
Full-Stack Observability FAQs
What is full-stack observability?
Full-stack observability/monitoring provides comprehensive visibility into all layers of an IT system, from the end-user experience to the underlying infrastructure. It involves monitoring and analyzing metrics, logs, and traces across the front-end, backend, application, infrastructure, and network layers to ensure optimal performance and quick issue resolution. This holistic approach enables proactive detection and resolution of problems, improving overall system reliability and user satisfaction.
What’s the difference between observability and monitoring?
Monitoring involves tracking predefined metrics and system states to ensure components are operating within acceptable parameters and to alert on specific issues. Observability, on the other hand, focuses on understanding the internal state of a system by analyzing a broad range of data, including metrics, logs, and traces, to diagnose and resolve complex problems. While monitoring tells you when something is wrong, observability helps you understand why it is happening and how to fix it.
What is telemetry?
In IT, telemetry is the automated process of collecting, transmitting, and analyzing data from remote sources to monitor and manage systems. OpenTelemetry is an open source project that standardizes the way telemetry data is collected and used across different forms and tools.