Alert! Friday Fire Drill
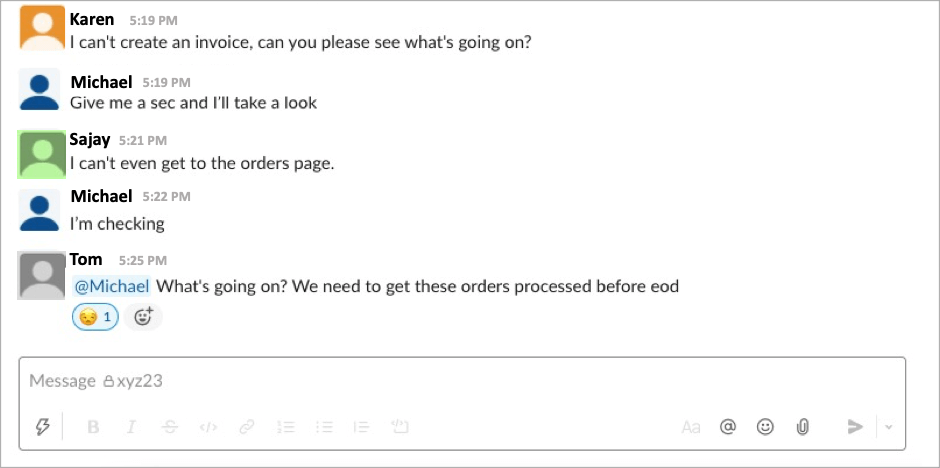
It’s the end of a quiet Friday and you’re about to finish up for the week when Slack starts going crazy. Orders aren’t being fulfilled and no one has any idea why.

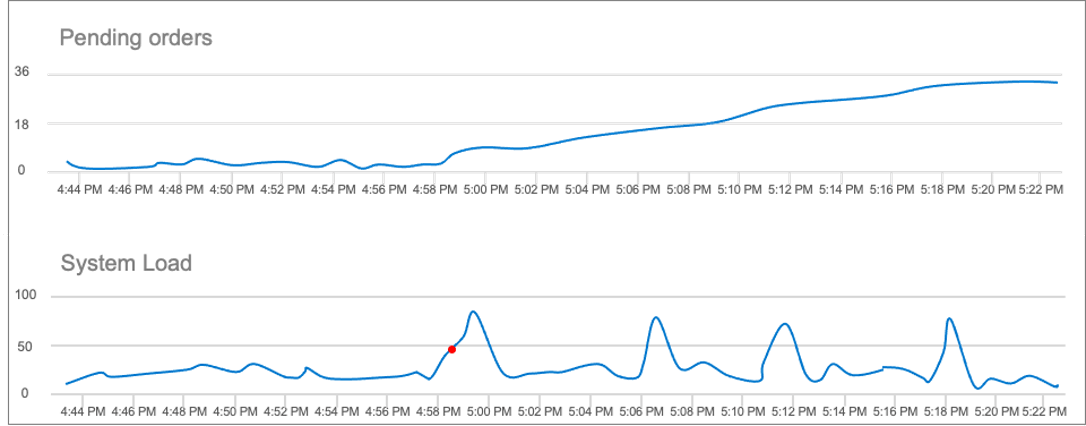
Something bad is happening, but what is it and why weren’t you alerted by your monitoring tool? You check the Cisco AppDynamics custom dashboard to examine business metrics and system load.

The system load has been spiking periodically since 4:58 PM, but never long enough to trigger a health rule violation in AppDynamics. Since the number of pending orders continues to increase, there’s clearly an issue somewhere.
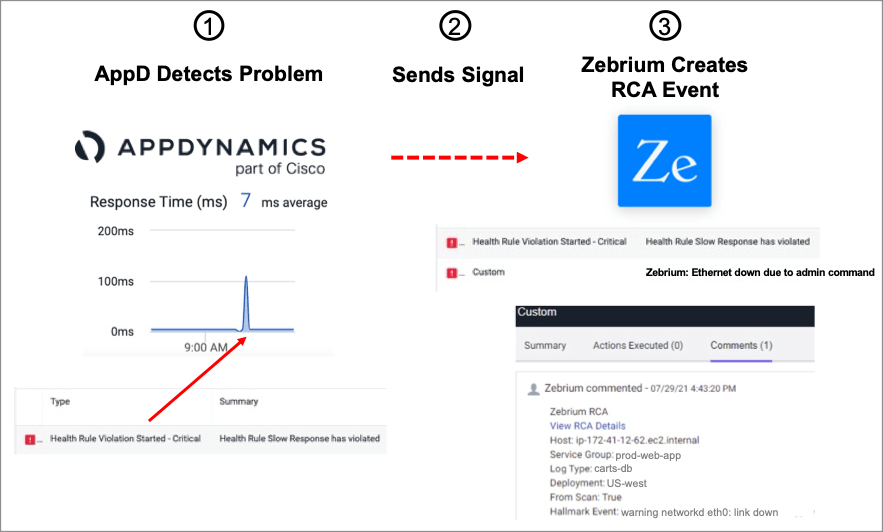
You also see a red dot on the System Load chart (above) coinciding with the time when the issue of the pending orders started. This dot represents a custom event that Zebrium sent to AppDynamics, indicating it found an incident in the log files. By clicking it, you can see the details that Zebrium’s machine learning has uncovered, as shown below:

Of course! You remember seeing all those emails about the certificate expiring and should have done something about it weeks ago. A few minutes later: crisis averted, certificate issue fixed. Your weekend has started.
How Was This Kind of Detection Possible?
This easy incident resolution was made possible by the recently announced integration between AppDynamics and Zebrium. Here’s a short explanation of how it works:
AppDynamics collects, processes, and monitors metrics gathered across the stack. In addition, a copy of all logs are sent to the Zebrium Machine Learning (ML) engine. In simple terms, the logs are processed by an unsupervised ML pipeline that starts by structuring, categorizing, and learning the patterns for each type of log line. The Zebrium ML engine then looks for clusters of correlated anomalies across the logs. When it finds one, it generates a root cause report and sends it to AppDynamics as a custom event, which contains a link back to Zebrium for more details.
This ML-derived root cause report includes a plain-language summary created with the GPT-3 AI language model as well as a small set of log lines that help explain the details of the problem. In the example above, the plain language summary was shown directly in an AppDynamics dashboard; by clicking the “details” link, the user can view the full root-cause report within Zebrium.
Here’s a short video showing what this looks like in real life:
Avoid the Root Cause Bottleneck
Our Friday afternoon scenario involved a completely new problem where no pre-existing health rules or other business-metric triggers were in place in AppDynamics to detect the problem. In this case, the AppDynamics dashboard and custom event enabled a very quick resolution.
However, there is also a more common use case where AppDynamics and Zebrium integration can speed up the resolution of almost any kind of incident. Let’s say you’ve built a set of health rules in AppDynamics that are able detect a large range of known problems. Even though this will let you detect most problems, finding their root cause can sometimes require manual investigation—usually hunting through dashboards and AppDynamics snapshots, and then drilling down and searching through logs.
In these cases, the AppDynamics and Zebrium integration can significantly speed up the identification of the root cause through the following flow:

- AppDynamics detects a health rule violation and triggers an alert.
- At the same time, AppDynamics sends an alert to Zebrium.
- Zebrium generates a root-cause report based on the signal request and sends it back to AppDynamics as a custom event. This event contains a description of the problem, along with a link back to Zebrium for more details.
The net effect of this integration? When AppDynamics detects a problem it immediately alerts the user, who’s then able to see the root cause (found in the logs by Zebrium) through the custom event sent to AppDynamics.
So don’t wait until a nasty problem strikes at the most inconvenient time. Request a free trial>
 See ScienceLogic in actionTake a Tour
 Take Skylar One for a SpinStart Your Test Drive
 The Gartner® Magic Quadrant™ for Observability PlatformsRead the Report
 The Forrester Wave™: AIOps Platforms, Q2 2025Access the Report
 Cut the Noise. Prove the Value. Skylar Advisor.Save Your Seat

