It’s no secret – data center management is moving away from traditional tools and into a software-defined world. This new frontier means adding a virtualization (or abstraction) layer on top of computer hardware that will enable vendors to automate manual tasks and improve operations productivity.
However, this shift also creates new monitoring challenges.
Throughout the years, the number of software-defined elements has grown, with each advancement creating new demands for data center operations teams. The stable and fixed environment they were accustomed to has given way to dynamic and increasingly complex underlying technology that has made troubleshooting challenging. Consequently, organizations are now struggling with how to oversee their Software-Defined Data Centers (SDDC).
A Brief Look Back: How We Got Here
Software-defined systems started with the virtualization of servers and moved to software-defined networks (SDNs) and storage systems. With a SDN, staff spends less time hard coding network configuration information and more time establishing policies that devices follow as they enter the network and use company resources. Always looking to move faster, ops teams began to utilize hyper-converged solutions that bundle server, storage, networking, and virtualization features in a single system. In doing so, these products require less time for configuration and maintenance than legacy components.
But the benefits also carry consequences.
Troubleshooting the systems became increasingly difficult because operators had – and continue to have – little visibility into the underlying infrastructure. One reason is the number of platforms at play. Although organizations might use one vendor for their SDN, they’re often using a different vendor for storage and another for compute. And since the vendors are diverse, their systems operate independently, requiring additional time – and tools – to piece together a full picture of the network. To make matters worse, network services that were originally limited to one or a few physical appliances are now spread across any number of virtual appliances, leading to device sprawl. Also, these systems are dynamic, so the traditional approach of monitoring various system entry and exit points is not as effective.
The Consolidation and Orchestration Conundrum
Companies’ use of technology is expanding to more locations and endpoints. As previously mentioned, they have autonomous platforms that manage one device or component, and typically the operations team needs to pull information from the various pieces. Often working with legacy data center equipment (appliances, storage arrays, purpose-built servers, and network devices), they collect performance data through a combination of older interfaces like Simple Network Management Protocol (SNMP) and new open source solutions, such as Kubernetes.
All the while, the ops teams have to collect, correlate, and evaluate performance data to figure out what is happening with their systems – a time consuming, often error-prone process.
And then you have the issue of the overwhelming number of alerts that are generated, usually in a vacuum, so they lack the context necessary to identify their origin and act quickly. And as many ops members will attest to, the sheer volume of information generated can be overwhelming.
As companies continue their reliance on technology to meet market and agility demands, it becomes impossible for humans — even the most highly skilled among us — to keep up and understand what particular element may be causing an application to misbehave. Data center engineers need help isolating root causes and remediating bottlenecks across domains quickly and easily.
Bringing it All Together – How to Monitor and Manage your SDDC
Today’s agile businesses need a common operating environment; one that affords full visibility, empowering them with the ability to automatically connect, run, and securely manage all of their compute, storage, system, and network resources.
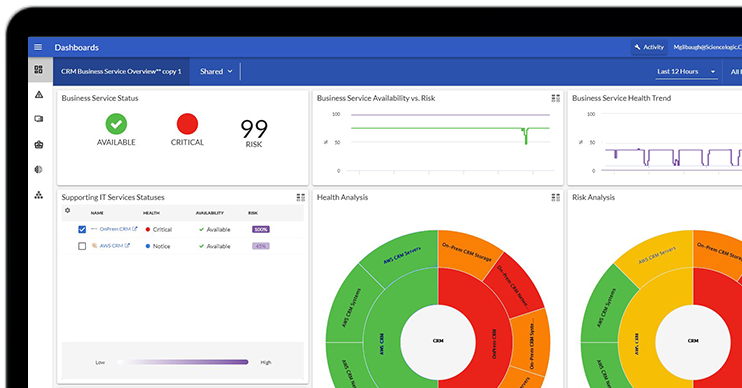
ScienceLogic’s SL1 platform solves SDN management shortcomings by collecting information from all of your software-defined network infrastructure systems. SL1 integrates with leading SDN products, such as Cisco Systems Inc.’s Application Centric Infrastructure (ACI) and VMware Inc.’s NSX, and SD WAN systems from top suppliers, like Cisco and Aruba.
SL1 also links the underlying hardware to the software abstraction layer. The platform’s discovery mechanism identifies enterprise resources and supports the most popular solutions, including:
- Virtualized environments: VMware, Citrix XenServer, Microsoft Hyper-V, Citrix, and Red Hat
- Converged infrastructure: Vblock, FlexPod, HyperFlex, and Nutanix.
- Cloud services: AWS, Azure, Google Cloud Platform, IBM Cloud)
- IT Service Management (ITSM) and ticketing tools: ServiceNow, BMC Remedy, ZenDesk
In addition, the platform illustrates how different components, like a server and a storage system, are related to one another. Because the staff sees all of the infrastructure (physical, virtual, cloud, serverless, and microservices) data center operations have the context needed to troubleshoot and address performance problems.
SL1 dynamically maps and tracks infrastructure, application and service relationships across static and dynamic workloads that extend from the data center to the cloud. The SL1 platform also delivers high levels of orchestration so operations teams can automate arrangement, coordination, and management of the IT infrastructure. Teams access alerts instantly and always know the status of their equipment. SL1 provides IT operation teams with actionable insights to resolve problems quickly in today’s digital, ever-changing world. SL1 offers businesses with the platform they need to manage their SDDC.
To learn more about SL1 and its ability to monitor your SDDC, visit https://sciencelogic.com/platform/overview