
As IT environments become increasingly complex, ITOps teams are struggling to manage massive amounts of operational telemetry data. Hybrid cloud environments continue to grow more distributed, diverse, and dynamic. As a result, teams charged with monitoring and maintaining service health must manage a workload-intensive mix of legacy and modern applications and infrastructure.
Even as the volume, variety, and velocity of operational telemetry data increases exponentially, too many ITOps teams are stuck with limited tools, inconsistent workflows, and manual troubleshooting processes that prevent fast resolution of issues. The inevitable result is spiraling costs, inflexible systems, and poor customer and user experiences.
ScienceLogic can help. The ScienceLogic AI Platform offers tools for monitoring and observability that leverage artificial intelligence (AI) and machine learning (ML) to manage and analyze operational telemetry faster, more accurately, and with greater ease.
The challenge of leveraging operational telemetry
Operational telemetry is the automatic measurement and transmission of data from remote sources. Telemetry enables monitoring and observability solutions to collect several kinds of critical data across complex systems.
- Logs are files within software environments that record events, warnings, and errors. Contextual annotations in logs help developers and ITOps teams to efficiently identify issues and root causes. When troubleshooting, operational telemetry solutions typically aggregate data from multiple log files for collective analysis.
- Metrics are quantifiable measurements that communicate the status and performance of applications and infrastructure. Metrics provide real-time insight into the status of resources, helping IT teams to know whether applications and assets are responsive and performing as intended.
- Traces track a request as it flows through an application. Traces record how long it takes each component of the app to process the request and pass on the result. Traces can also help determine which part of an application initially triggered an error.
While these data points are valuable for ITOps teams, the rapid pace of change in hybrid cloud environments creates several challenges for teams managing operational telemetry.
- Multiple formats: Various systems and applications often produce operational telemetry in unique formats that make it harder to normalize data. For example, logs from applications are notoriously unique in the vocabulary and syntax they use.
- Data silos: With highly diverse and distributed IT environments, telemetry data is often siloed in different systems, preventing ITOps teams from gaining a holistic understanding of service health.
- Massive volumes: As IT environments continue to expand, the volume of data that IT teams must manage and analyze can quickly become overwhelming.
To support monitoring and observability efforts, ITOps need modern platforms that automate operations or artificial intelligence for IT operations (AIOps) solutions to process operational telemetry inputs with greater speed, accuracy, and results.
Managing operational telemetry with SL1
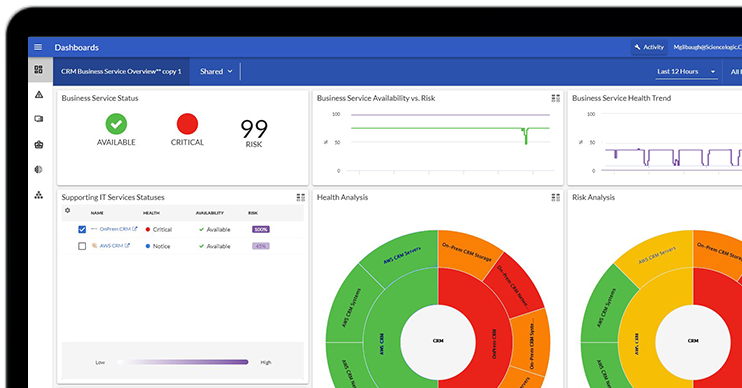
ScienceLogic’s AIOps and observability solutions monitor your digital footprint wherever it resides, providing greater visibility and improving availability of business services across your organization. As a leader in IT operations management, ScienceLogic provides modern ITOps teams with actionable insights to predict and resolve problems faster.
To manage the volume, variety, and velocity of operational telemetry data, ScienceLogic provides a unified platform that eliminates data silos and opens up opportunities for cross-functional investigation and holistic end-to-end infrastructure monitoring. ScienceLogic removes the blind spots from telemetry analysis, allowing teams to more quickly identify problems, fix them, and move forward.
SL1, part of the ScienceLogic AI Platform, enables you to:
- See everything. ScienceLogic uses a variety of techniques—including SNMP, SSH, API, syslog, agent, and agentless – to discover devices and collect comprehensive operational telemetry information. After aligning, merging, aggregating, de-duping, and normalizing the data, SL1 infuses it into an operational data lake. This allows ITOps teams to build queries, generate reports, and configure dashboards to gain actionable insight.
- Understand context. SL1 leverages AI/ML capabilities to automatically correlate and analyze operational telemetry and contextual information, providing deeper insights into system health. Generative AI/ML algorithms proactively detect rare or anomalous service behavior and correlate it with a service context, automatically cutting through the noise to uncover critical issues.
- Automate actions. SL1 integrates and shares data across technologies while applying multi-directional integrations to automate responsive and proactive actions at cloud scale. ITOps teams can automate ticketing, troubleshooting, and configuration updates to speed up incident resolution and eliminate manual workflows.
Skylar RCA: automating root cause analysis
Operational telemetry should help ITOps teams detect and resolve issues faster. However, traditional processes for determining IT root cause analysis inevitably require experienced specialists to spend hours manually sifting through countless log files.
ScienceLogic’s Skylar Automated Root Cause Analysis (RCA) dramatically accelerates this process by automatically ingesting and running ML-driven analysis on messages from millions or billions of log files produced by operational telemetry technology.
By leveraging ML and AI to process log messages in real time, Skylar Automated RCA can identify the root cause of issues 10x faster than traditional solutions. This ScienceLogic technology can also identify the “unknown unknowns” – the unusual or novel issues caused by the increasing complexity of modern applications. Skylar Automated RCA catches new problems without requiring teams to manually build complex rules for monitoring tools. Skylar Automated RCA also correlates unusual behavior with recent changes in performance metrics, helping teams better understand potential business or service impact.
Why ScienceLogic?
ScienceLogic delivers actionable insights that empower modern IT operations and help to predict and resolve problems faster in a digital, ephemeral world. The ScienceLogic platform comprises multiple solutions, including tools for AIOps, hybrid cloud observability, automated root cause analysis, and network automation. By combining integrated generative AI, automation, and data capabilities, ScienceLogic helps organizations around the world to accelerate the journey toward autonomic IT and digitally transform themselves by simplifying management of complex, distributed IT services.
Operational Telemetry FAQs
What is operational telemetry?
In IT infrastructure monitoring, operational telemetry refers to the automated collection, transmission, and analysis of data related to the performance and health of IT systems. This data helps administrators and engineers ensure that the infrastructure operates efficiently, identify and resolve issues quickly, and plan for future capacity needs.
What is Open Telemetry?
Open Telemetry, or OpenTelemetry (OTEL), is an open-source observability framework for cloud-native software, providing tools, APIs, and SDKs for collecting, processing, and exporting telemetry data such as metrics, logs, and traces. It helps to standardize the way telemetry data is collected and utilized, making it easier for developers to monitor and understand the performance of their applications.