- Why ScienceLogic
- Main Menu
- Why ScienceLogic
Why ScienceLogic
See why our AI Platform fuels innovation for top-tier organizations.
- Why ScienceLogic
- Customer Enablement
- Trust Center
- Technology Partners
- Pricing
- Contact Us
- Product ToursSee ScienceLogic in actionTake a Tour
Experience the platform and use cases first-hand.
- Platform
- Main Menu
- Platform
Platform
Simplified. Modular-based. Efficient. AI-Enabled.
- Platform Modules
- Core Technologies
- Platform Overview
- Virtual ExperienceSkylar AI RoadmapRegister Today
Learn about our game-changing AI innovations! Join this virtual experience with our CEO, Dave Link and our Chief Product Officer, Mike Nappi.
November 26
- Solutions
- Main Menu
- Solutions
Solutions
From automating workflows to reducing MTTR, there's a solution for your use case.
- By Industry
- By Use Case
- By Initiative
- Explore All Solutions
- Survey ResultsThe Future of AI in IT OperationsGet the Results
What’s holding organizations back from implementing automation and AI in their IT operations?
- Learn
- Main Menu
- Learn
Learn
Catalyze and automate essential operations throughout the organization with these insights.
- Blog
- Community
- Resources
- Events
- Podcasts
- Platform Tours
- Customer Success Stories
- Training & Certification
- Explore All Resources
- 157% Return on InvestmentForrester TEI ReportRead the Report
Forrester examined four enterprises running large, complex IT estates to see the results of an investment in ScienceLogic’s SL1 AIOps platform.
- Company
- Main Menu
- Company
Company
We’re on a mission to make your IT team’s lives easier and your customers happier.
- About Us
- Careers
- Newsroom
- Leadership
- Contact Us
- Virtual Event2024 Innovators Awards SpotlightRegister Now
Save your seat for our upcoming PowerHour session on November 20th.
ZELK vs ELK: Zebrium vs Elastic Machine Learning
We often get asked how Zebrium ZELK Stack machine learning (ML) compares to native ML for Elasticsearch. The easiest way to answer this is to see the two technologies side by side. This short (3-minute) video demonstrates what each solution is able to uncover from the exact same log data. No manual training, rules, or special configuration were used for either ZELK or ELK.
If you don’t have time to watch the video, we simulated a problem by shutting down PostgreSQL in our production Atlassian environment which caused the Jira application to fail. The logs from this were sent to both ZELK and ELK.
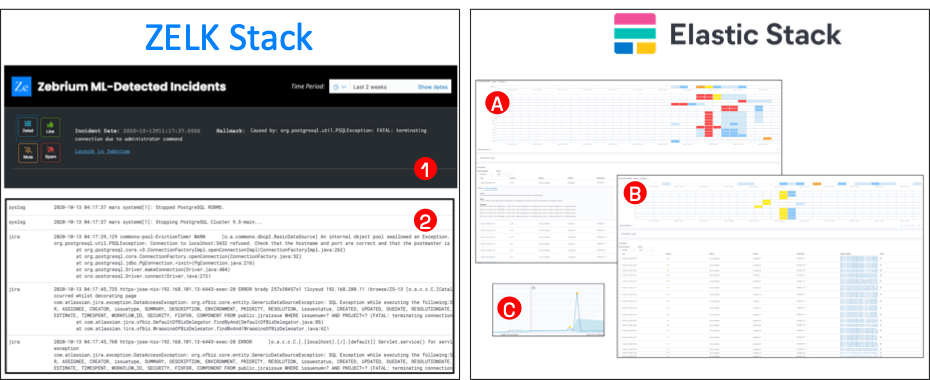
These two pictures show the end result:
ZELK Stack (LHS):
- (1) The ZELK incident dashboard shows a single incident: “SQL exception due to administrator command”.
- (2) Clicking the incident details button shows the root cause (SQL stopped) and the symptoms (Jira exception unable to communicate with SQL).
- Within seconds of looking, it was clear that ZELK was able to not only catch the problem but also show its root cause.
Elastic Stack (RHS):
- I configured three different machine learning anomaly detection jobs to try and find the problem.
- (A) and (B) use Elastic machine learning categorization to look for event categories with abnormal counts within 15-minute time buckets.
- (A) shows event categories with anomalous counts – which didn’t yield anything useful.
- (B) shows rare event categories and, at the time the incident occurred, it found almost 300 examples of rare categories. I manually looked at each one and managed to find the “SQL stopped” event (it was ML category #102).
- (C) shows anomalies in event rates. One of the smaller spikes coincides with the time of the problem, but it would be difficult to pinpoint the problem just from this.
Summary: Incident Detection vs Anomaly Detection
Zebrium’s goal is to use machine learning to catch incidents and show root cause. It does this by looking for hotspots of abnormally correlated anomalous patterns across logs and metrics. It has been tested with hundreds of production software stacks and typically achieves accuracy with few false positives within approximately 24 hours – without requiring any manual configuration or training. Best of all, with ZELK Stack, you can do all of this right inside the Elastic Stack.
Elastic ML anomaly detection (part of X-Pack in the Elastic platinum pricing tier) is able to categorize events and then find anomalous event counts within user-defined time buckets. It can also find anomalous event ingest rates. A user can build and tune machine learning jobs to visualize these anomalies. However, as the example above shows, the dashboards often require significant human inspection and analysis in order to find useful information.
Please try this for yourself using your own data. You can find out more and sign up for a free trial here.