By: Matt Luebke, Distinguished Engineer at ScienceLogic
Although Asimov wrote the quote above about a crisis in the futuristic Galactic Empire, it can also be applied to data. The quote eloquently summarizes why catching abnormalities in the earliest, “embryotic” state can save you from crises such as downtime, by helping you find the root cause of an issue faster, and reducing mean time to repair. How is this done?
Anomaly detection is a technique used to identify abnormal patterns in data that do not fit with expected behavior. A quick Google search can tell you that. But, what precisely does it mean for data to be “normal,” or for that data to be labeled an “anomaly”?
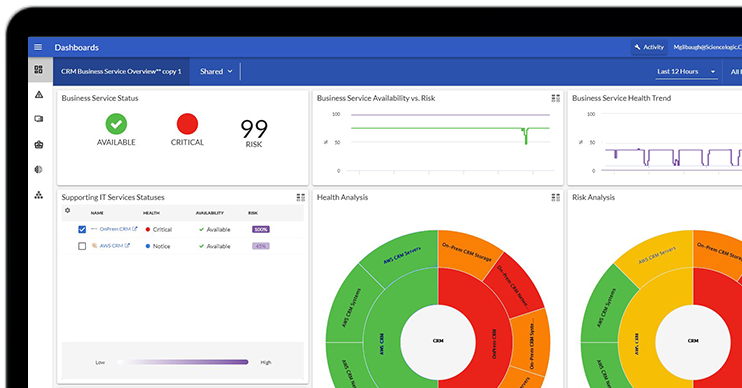
Consider the following business request: The marketing department would like IT to start monitoring the corporate website. Very quickly, you can find a considerable amount of interesting metrics to gather: the number of visits, number of unique visitors, duration of stay, and more. With the ScienceLogic SL1 platform, you can satisfy this request by installing a pre-built PowerPack that gives you the exact metrics you need. Simple, right?
And marketing is thrilled to access all this new data. By gathering this data over time and viewing a time-series graph of it, you can probably even start to pick out interesting patterns. You might see a surge in traffic during business hours and a drop off at lunchtime, or an enormous surge in traffic to your e-commerce site during Cyber Monday.
But let’s consider thresholding. Thresholding is where things can take a sharp turn away from easy into very, very complicated. Is that drop-off in page views due to the normal lunchtime drop-off, or a broken page deployment? Is that surge a normal Monday morning surge or a DDoS attack? Do I want an alert for zero page views, if it’s normal for there to be no visitors to my website at 3 a.m.?
What is “normal” in the ever-changing world of IT?
Over time, ScienceLogic has built an impressive out-of-the-box set of static thresholds using industry best practices, vendor documentation, and valuable customer feedback. However, a significant drawback to static thresholding systems is that they cannot automatically adapt to changes in behavior. Moreover, the logic behind static thresholds is often quite complex.
Usually, that complexity is in place to avoid alarm bells ringing at 3 a.m. for what turns out to be a false-positive alert. An example of a false-positive alert would be:
“Alert if CPU rises above 95%, but only if it stays there for three polling cycles.”
If you’re not careful, you can even over-correct from there and end up missing crucial failures because your complex rules let something unusual slip through the cracks without triggering any alarms.
A much better scenario would be to alert if the CPU rises above 95%, but only if it doesn’t normally do that. Another use case is to detect if that the CPU didn’t rise to 90% when the nightly backup job fails to kick off. The bottom line is: there is no static threshold for normal. This is where anomaly detection can help the most.
And now for some nerdy math …
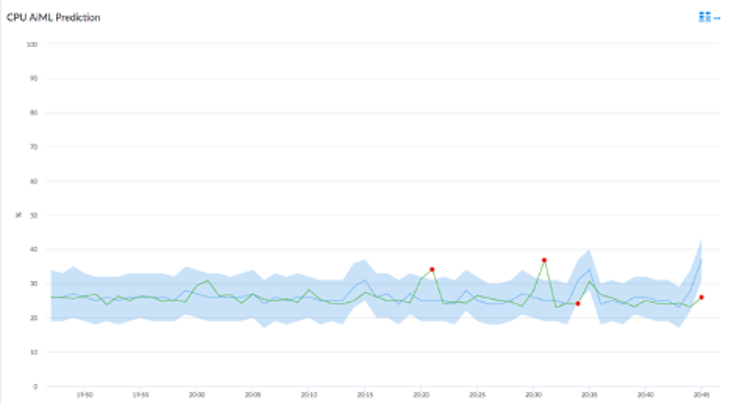
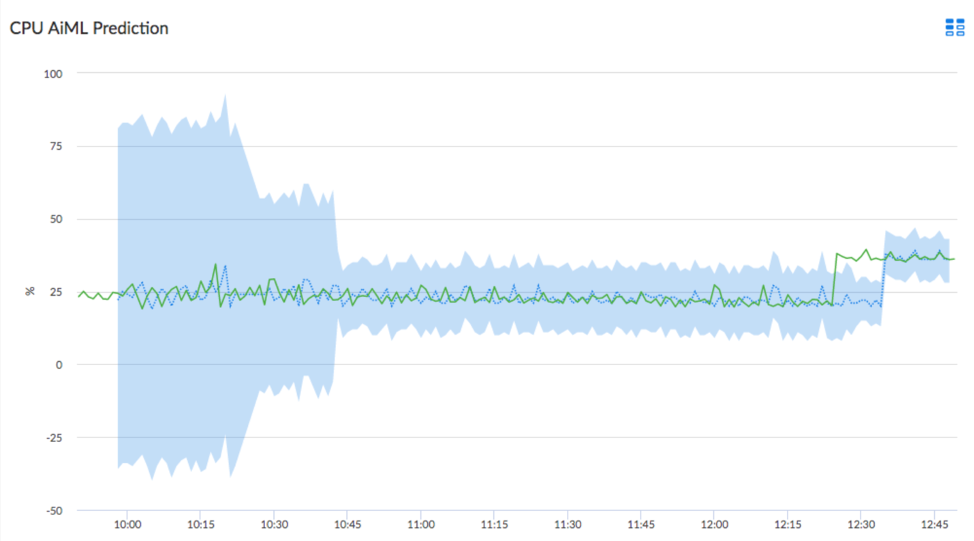
As we begin to dig into the technical side a little more, I’d like to take a moment to describe the SL1 predictor. We can think about the SL1 predictor as a collection of algorithms (with lots of nerdy math) and methods that act using those algorithms. The main methods we’ll be talking about here are prediction and training.
As data enters the SL1 platform, the predictor calculates within what range it thinks the next data point should occur. This range is called a confidence interval. At first, with limited or no prior data, the confidence interval is quite large, but after a bit of time and some training, these predictions can become very accurate.
Training is where the predictor learns to recognize patterns in the data. Training can happen in-bulk with large sections of any pre-existing data, and the predictor continues to learn as new data enters the system in a process called continuous learning.
Over time and with more training from each subsequent data point, the confidence interval narrows, which has the effect of allowing the predictor to make better and better predictions about the data.
There are multiple choices for predictors, each relying on different machine learning algorithms to accommodate different types of data. Some algorithms require more historical data than others, some are more CPU intensive, and some even thrive using specialized GPU hardware.
Tolerance for “false positives” (also called a type I error) and “false negatives” (a type II error) are also factors in determining which algorithm or predictor to use.
While the choice of which predictor to use sounds like it might be difficult, it is as simple as picking which attributes are most important to you. The ScienceLogic SL1 platform can test and retest each predictor against your data until it finds the perfect fit.
Anomaly detection is a foundational AI/ML feature that helps you find otherwise undetectable problems and alert on them quickly. And in doing so, enables you to prevent customer and business impacting downtime.
Be on the lookout for future blog posts in this series, where we will dig into much more detail on topics like:
- “The algorithms behind anomaly detection”
- “Machine learning at scale”
- “Choosing the right algorithm for your data”
- “Precision vs. recall and why it matters”
Want to learn more about machine learning? Watch the webinar, “Getting Machine-Learning Assisted Insights & Automation”.