The Psychological Comfort of Visibility and the Risk It Can Mask
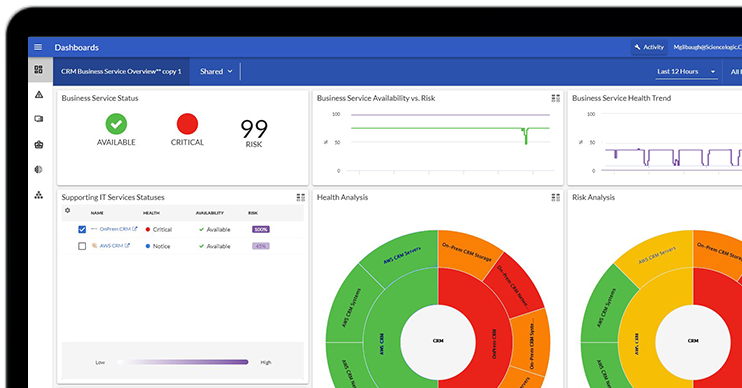
Modern operations teams work within a constant stream of dashboards, status summaries, and health indicators that turn complex environments into organized visual displays. Large screens show color-coded service conditions. Executive reports quantify uptime. Observability platforms map system dependencies across cloud, hybrid, and distributed architectures.
This visual structure creates a sense of order. In environments defined by constant change, that sense of order can feel like control.
The psychological effect of visibility is powerful. When teams can see complexity, categorize it, and report on it, they reduce uncertainty. Leaders gain tangible reference points for performance discussions. Operations teams gain confidence that, when instability emerges, monitoring systems will surface it quickly.
Stable dashboards can reinforce the belief that service-level agreement commitments are protected. But visibility describes current conditions. It does not inherently model how exposure changes as systems evolve or show whether teams can act fast enough to protect service commitments.
This shift changes the mandate for operations teams. Reporting service health is no longer enough. The mandate is now to understand where exposure is forming and intervene before instability becomes customer-visible disruption.
How Visible Health Can Conceal Emerging Exposure
Dashboards summarize health based on predefined metrics and thresholds. When latency stays within acceptable bounds and error rates remain below alert limits, services appear stable. Within the boundaries of what the dashboard measures, that representation may be accurate.
The limitation lies in what dashboards are designed to display.
In distributed systems, reliability degradation rarely begins as a sudden, isolated failure. It often develops gradually across interconnected services. Slight increases in dependency latency, intermittent API instability, or marginal resource imbalances may appear inconsequential when evaluated individually. Each signal may remain below alert thresholds while still contributing to rising fragility across the broader service ecosystem.
When teams evaluate these signals collectively within the context of service topology, dependency relationships, and business commitments, they may reveal accumulating SLA exposure that is not yet reflected in the dashboard’s visible state. Because dashboards prioritize discrete threshold breaches, they may miss the compounded effect of multiple subtle degradations occurring simultaneously across dependencies.
The result is a structural gap between what is visible and what is vulnerable.
The issue is not whether the dashboard is accurate. It is whether the operating model can see how small signals combine into service risk.
The Persistence of Threshold-Based Thinking
Traditional monitoring approaches were designed for more contained infrastructure environments, where static thresholds often provided useful proxies for risk. In those environments, exceeding a defined metric limit frequently correlated with imminent disruption.
As architectures have evolved toward cloud-native, microservices-based, and API-driven models, the relationship between individual metrics and service impact has become more complex.
Modern systems exhibit nonlinear behavior shaped by workload patterns, scaling dynamics, configuration changes, and cross-service dependencies. A fluctuation that is harmless under one set of conditions may become destabilizing under another when it coincides with a dependency change, capacity constraint, or customer-facing workflow.
Despite this complexity, many operational models still rely primarily on static thresholds to define service health. That reliance reinforces a reactive posture, where teams acknowledge risk only after it becomes visible through predefined alert criteria.
Thresholds provide clarity, but clarity does not guarantee foresight. When risk accumulates across multiple interacting components, waiting for a single metric to breach its limit can delay intervention until exposure has already intensified and the time between detection, understanding and action has already narrowed.
Alert Fatigue and the Normalization of Minor Instability
High-volume telemetry environments introduce another challenge: psychological adaptation.
As teams encounter frequent low-severity alerts and transient anomalies, they develop filtering mechanisms that prioritize immediate disruption over gradual degradation. Recurrent minor instability becomes familiar, and familiarity reduces perceived urgency.
Over time, this normalization subtly shifts operational baselines. Conditions that once prompted deeper investigation may become routine. Intermittent latency spikes, short-lived dependency errors, or sporadic configuration inconsistencies may no longer trigger sustained scrutiny when they appear to resolve without direct customer impact.
Each event may seem insignificant in isolation. Together, they can erode service resilience and shift teams from prevention into recovery mode.
When a larger disruption eventually occurs, retrospective analysis often reveals precursor signals that were visible but never evaluated collectively through a continuous exposure model. In those cases, organizations had visibility throughout the degradation process. What they lacked was a mechanism to translate that visibility into forward-looking risk assessment and a governed path for intervention before exposure became customer-visible.
Distinguishing Observability from Operational Control
Observability platforms remain indispensable to modern operations. Telemetry ingestion, event correlation, and topology mapping give teams the foundation they need to diagnose and understand system behavior.
But organizations must recognize a critical distinction: observability describes conditions, while operational control requires continuous interpretation of how those conditions affect business commitments.
Operational control depends on modeling relationships between infrastructure components, applications, and customer-facing services. It requires teams to evaluate whether emerging patterns increase the probability of SLA degradation, even when no individual metric has breached its threshold.
This approach shifts the focus from discrete events to cumulative exposure and from descriptive status to decision-ready insight.
Dashboards play an important role in communicating system status and supporting investigation. However, they do not inherently assess how interacting signals influence service-level commitments in real time. True control emerges only when telemetry is interpreted within service context and connected to proactive decision-making that teams can explain, govern and verify.
From Visual Reassurance to Reliability Governance
Closing the gap between visibility and control requires operational architectures that can correlate signals within service topology and model exposure dynamically.
Rather than relying solely on static thresholds, mature operations teams evaluate how multiple degradations interact and how those interactions affect the stability of business-critical services. When contextual intelligence is layered onto observability data, organizations can identify trajectories toward instability before customer impact becomes visible.
This capability enables earlier intervention in the degradation lifecycle. When contextual modeling is combined with governed automation, teams can execute mitigation actions within defined policy boundaries, reducing exposure while maintaining accountability.
That matters because speed without governance can create new risk. Speed with service context, approval logic, rollback criteria and verification protects service commitments.
Dashboards will continue to support situational awareness and communication. But as digital services become inseparable from revenue, reputation, and customer trust, enterprises must evolve beyond visual reassurance toward continuous reliability governance.
In complex environments, control depends not only on what teams can see, but also on how they interpret, model, and address emerging conditions before service commitments are compromised.
The practical next step is to evaluate the incident lifecycle through three questions: where does service context break down, where does decision latency expand, and where do teams lack governed action paths?
Skylar Advisor supports this shift by helping teams connect observability data with service-aware context, AI-driven correlation and governed operational workflows so they can shorten investigation paths and respond before risk becomes customer-visible impact.
If your dashboards show stability while operational complexity continues to grow, it may be time to examine how your organization models emerging SLA exposure. To see what continuous reliability governance can look like in practice, explore Skylar Advisor and AI-driven operations.