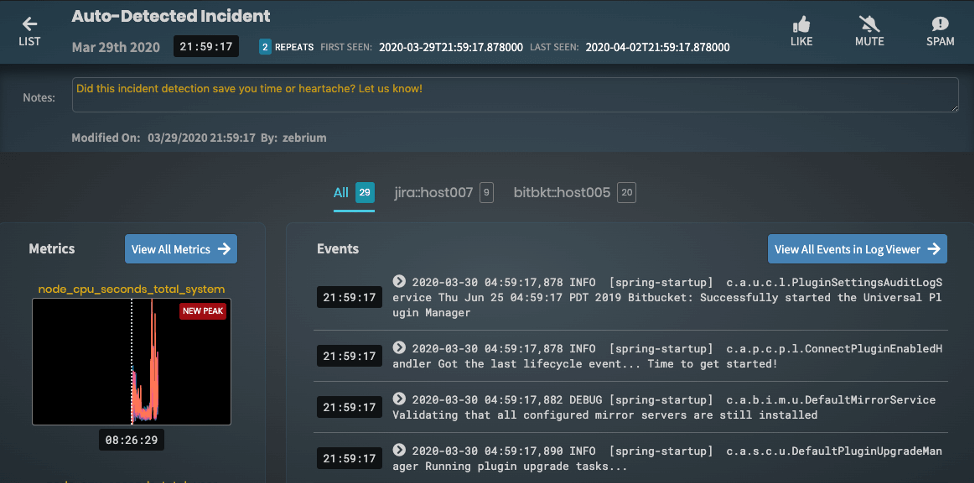
We believe the future of monitoring, especially for platforms like Kubernetes, is truly autonomous. Cloud-native applications are increasingly distributed, evolving faster, and failing in new ways, making it harder to monitor, troubleshoot and resolve incidents. Traditional approaches such as dashboards, carefully tuned alert rules, and searches through logs are reactive and time intensive, hurting productivity, the user experience, and MTTR. We believe machine learning can do much better – detecting anomalous patterns automatically, creating highly diagnostic incident alerts, and shortening time to resolution.
What do you imagine when you see “Anomaly Detection”?
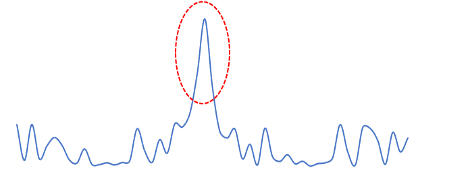
When you think about anomaly detection, you probably visualize it for metrics: detection of outlier values like peaks, dropouts, or other 
deviations from normal. In the realm of application monitoring metrics are scheduled measurements of a large set (thousands) of system health attributes – such as CPU, memory, latency, and throughput. So metrics anomaly detection can be a useful tool to detect application
health incidents, with the metrics anomalies serving as symptoms of the incident. A challenge with traditional time series anomaly detection is that it is noisy – applications can generate thousands of metrics, and on any given day it’s common to see many of them deviating from their historical ranges. Alerting on all of these would be a noisy mess, so users need to do more work to avoid alert fatigue. They must handpick which ones really matter, carefully tune thresholds, make adjustments for seasonality and trend lines, plus be thoughtful about algorithm selection.
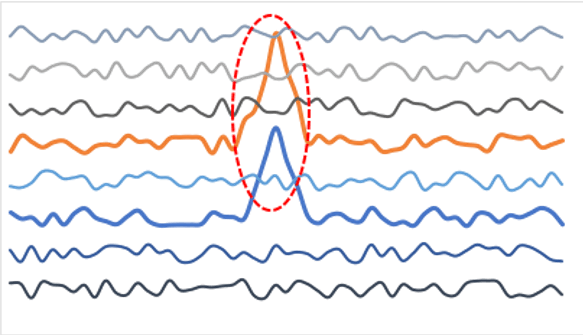
This approach is untenable to detect new failure modes (unknown failure modes with as yet unknown symptoms). And it does not take advantage of the fact that when software incidents occur, they almost never impact just one metric. For example, memory contention on a node impacts multiple containers. Similarly, network bottlenecks impact latency for many operations which show up in metrics.

To be useful for incident detection, anomaly detection has to work autonomously across all-time series, but also separate the signal from the noise by picking out the hotspots of correlated anomalies that are indicators of real problems. And to be even more useful, it should automatically correlate these metric anomaly hotspots with something that is even harder to build rules for – anomalies in log events.
Anomaly detection applied to logs is very different
Log events are generated synchronously with the execution of specific software paths. This makes them incredibly granular (micro-second or even finer resolution). They are also rich: since log events are only generated when specific conditions are encountered, they can selectively output data with almost unbounded cardinality (such as labels and IDs). Most significantly, events provide the best indication of causality. Where metrics measure aggregate symptoms about the application, log events are closely linked to specific code paths or error conditions in the software. For all of the above reasons, logs are an invaluable trove of information, so troubleshooting invariably involves digging through logs to find out the root cause of an incident.
What if you didn’t have to do this reactively? Why couldn’t anomaly detection also be applied to events, with the goal of detecting highly unusual patterns of code execution, or rare errors or conditions? In other words, patterns are diagnostic of a software problem, an infrastructure issue that impacts the application, or even security incidents. This is a bit harder to conceptualize than anomaly detection for metrics, but here is how it works.
Learn what to track
Metrics are explicitly tagged with labels and IDs – so it is clear what is being measured. Unfortunately, the link between a specific log event and the corresponding line of code is not explicit – most log events don’t contain references to source code, and they are typically unstructured, free-form outputs coded by developers to help them troubleshoot. As a result, many of them look similar to the human eye because they contain similar keywords or strings.
Luckily machine learning can do far better than a human in this regard – it only needs to see a few variants of each message type to fully extract the fixed and variable parts of each message type – rapidly learning all the unique message types. This essentially constitutes the “dictionary” of all unique event types generated by the application stack – all that’s missing is the corresponding line # from the source code.

Note that this event-type dictionary is not as big as you might think – an entire Atlassian suite has fewer than 1,000 unique event types.
Learn the normal, detect the abnormal

Once we’ve assembled their foundational dictionary of event types, another layer of ML learns the normal patterns of each event type. This includes things such as its frequency, periodicity, severity, and even the values of metrics embedded within each event type. Now when a log event breaks pattern significantly, it is anomalous.
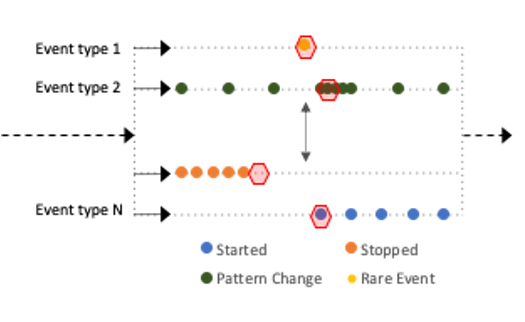
Particularly important variants include the first occurrence of a very rare event, and the sudden stoppage of a normal event (e.g. a system heartbeat).
Increase the contrast between signal and noise

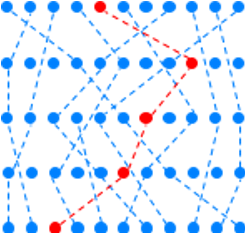
In practice you can’t stop there – most enterprise applications have dozens of services, with hundreds if not thousands of instances (many of them ephemeral), scaling operations, and frequent updates. Good anomaly detection can be very selective – picking out the one-in-a-million event that is truly anomalous. However, one in a million would still be too many things to focus on in an environment that generates billions of messages a day. Once again, machine learning is to the rescue – it takes advantage of the fact that a single anomaly in one event type is rarely alert-worthy – but when tightly clustered group of anomalies pops up across multiple event streams – that IS almost always alert-worthy. What constitutes an “unusually tight cluster” depends on the specific deployment of an application, so it needs to be learned on the fly.
See a complete narrative
This type of anomaly clustering doesn’t just improve signal-to-noise by several orders of magnitude. It also constructs an automatic summary of the incident – picking out the sequence of anomalous events and the related anomalous metrics, as well as highlighting the hosts and log types that fully describe the incident.

Conclusion
Done right, anomaly detection can enable autonomous incident creation, making it an incredibly powerful pillar of a monitoring strategy. It detects previously unknown problems the first time they occur and reduces MTTR by automatically surfacing the unusual events and anomalies in metrics that describe an incident. But doing it right means understanding unique event types, learning the patterns and correlations of log events and metrics, and detecting anomaly clusters with good signal-to-noise. And for this to be practical, all of this has to work without extensive configuration, manual tuning, or impractical training windows.
Want to learn more about Zebrium? Request a free trial>
 See ScienceLogic in actionTake a Tour
 Take Skylar One for a SpinStart Your Test Drive
 The Gartner® Magic Quadrant™ for Observability PlatformsRead the Report
 The Forrester Wave™: AIOps Platforms, Q2 2025Access the Report
 Future-Ready IT: Secure Migration, Faster Value, and Smarter OperationsWatch Now

