See why our AI Platform fuels innovation for top-tier organizations.
Experience the platform and use cases first-hand.
Observe. Advise. Automate.
Feel the power of AI-Driven Observability with a 14-day test drive.
From automating workflows to reducing MTTR, there's a solution for your use case.
See why ScienceLogic was named a Visionary.
Catalyze and automate essential operations throughout the organization with these insights.
See why ScienceLogic has been named a Leader, with the highest score in the Strategy category.
We’re on a mission to make your IT team’s lives easier and your customers happier.
Learn how your Site Reliability Engineering team can proactively prepare for incidents and recover from them swiftly.
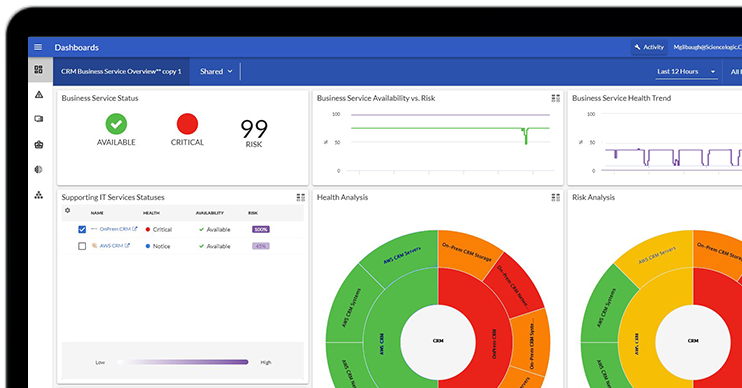
Skylar One Test Drive
The Gartner® Magic Quadrant™ for Observability Platforms
Forrester Names ScienceLogic a Leader in the Forrester Wave™: AIOps Platforms, Q2 2025 Report
How Telia Cygate Uses ScienceLogic to Monitor Complex IT Infrastructures
How Rackspace Modernized Its Monitoring with ScienceLogic
How Leidos Transformed Observability and Incident Response with ScienceLogic
How CDW Modernized Managed Services with ScienceLogic
How Softility Delivers Actionable Insights and Reduces Downtime with ScienceLogic
Softility Transforms World Top Global City Networks; Automation Saves 200K Hours
Leidos & ScienceLogic: Enhancing Mission Readiness Through Intelligent IT Ops
EMA Impact Brief: ScienceLogic Reimagines Its Platform with Skylar to Drive Agentic AI in ServiceOps
Solving MSP Complexity: Practical Insights + AI Solutions
Security & Network Configuration Checklist: Critical Steps to Use Agentic AI to Prevent Outages
The Future of Managed Services: Maximizing Profitability through Automation and Customer Experience