

5,000+ Integrations Built In. Extensible for Tomorrow.
Leverage out-of-the-box integrations for major platforms like AWS, Cisco, Microsoft, VMware, IBM, HPE, and ServiceNow, or create custom integrations and workflows with Skylar One Studio. ScienceLogic connects your technologies, synchronizes data across your management ecosystem, and helps automate IT operations across hybrid environments. The result is a more connected, adaptable IT ecosystem that reduces complexity today, gives you the flexibility to support whatever comes next, and helps teams get ScienceLogic SaaS up and running in a matter of hours.

Observe

Synchronize

Automate
ScienceLogic Integrations
All Application Automation AWS Cisco Cloud Compute Microsoft Monitoring
Network Security ServiceNow Storage Synchronization Video-UC VMWare

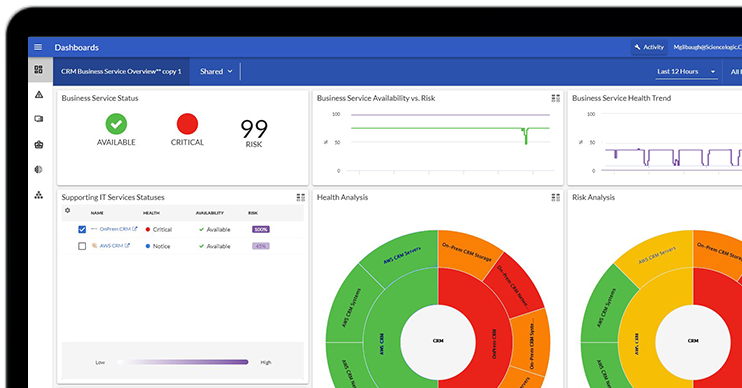
PowerPacks provide out-of-the-box business agility.
Each PowerPack can define what data to collect, how to synthesize and evaluate any combination of data to generate actionable events, what automations to trigger when events occur, and how to present the data and events within role-specific dashboards and reports.
Observability PowerPacks provide real-time visibility and context into multi-vendor network, storage, compute, cloud, application, IoT, and unified communication systems and environments.
SyncPacks enable data federation and IT workflow automation with your IT management ecosystem tools including ITSM Service Desk, CMDB, notification & collaboration tools, and more.
Automation PowerPacks leverage a vast library of expert best practice automations that you can refine and extend to automate troubleshooting and remediation steps and processes.

Build your own PowerPacks.
Have custom equipment or applications that you need to harmonize with the rest of your IT environment? We’ve got you covered. Skylar One Studio offers you flexible options to quickly build and deploy your own custom integrations. The SDK leverages common protocols such as REST APIs, JMX, SSH, Prometheus, and more for rapid, low-code integration development.
Trusted by customers.
ScienceLogic has been top-rated by customers for the extensibility and flexibility of our platform year after year, from observability technology and value to automating IT workflows.