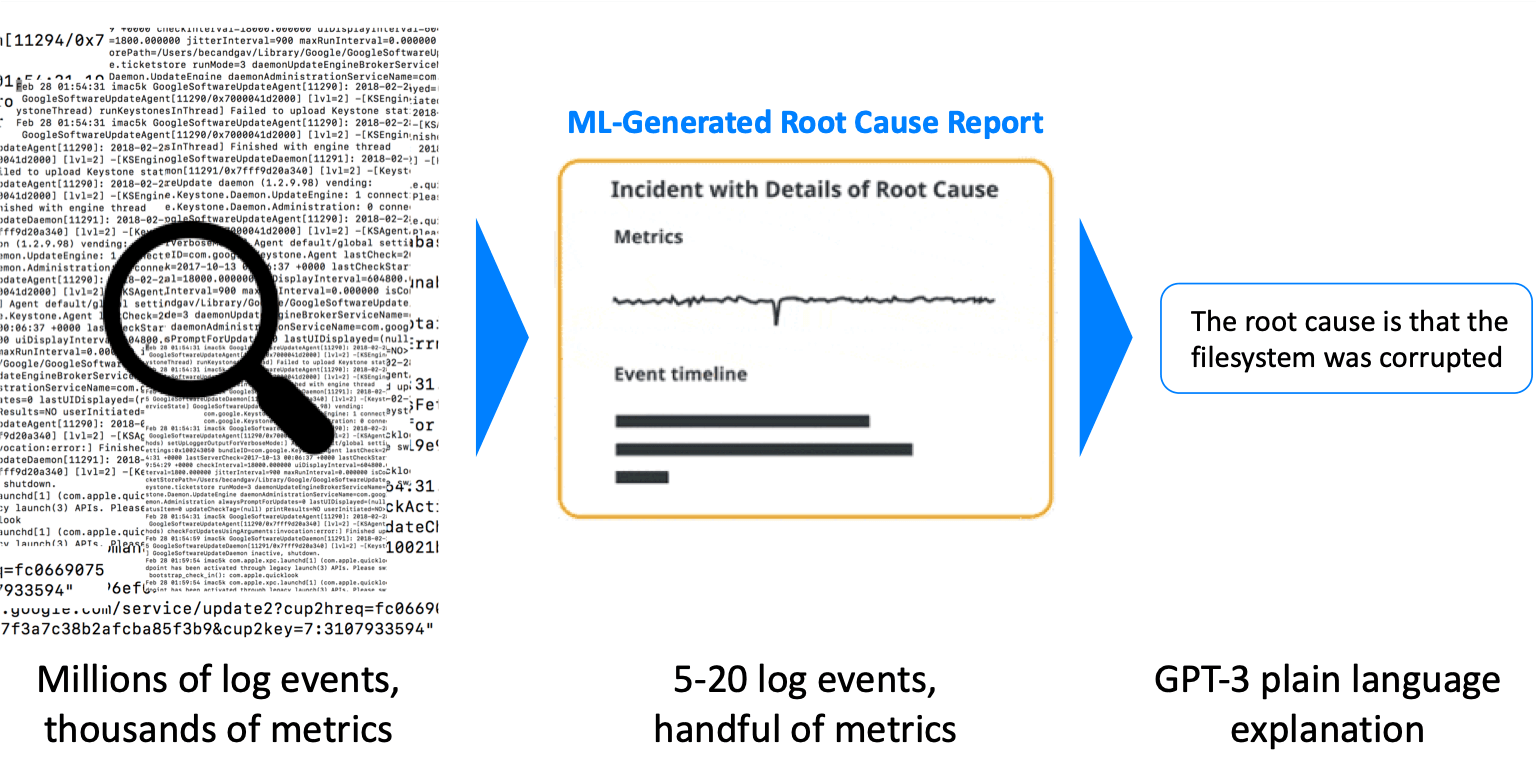
A few weeks ago, Larry Lancaster, wrote about a new beta feature leveraging the GPT-3 language model – Using GPT-3 for plain language incident root cause from logs. To recap – Zebrium’s unsupervised ML identifies the root cause of incidents and generates concise reports (typically between 5-20 log events) identifying the first event in the sequence (typically the root cause), worst symptom, other associated events and correlated metrics anomalies.

As Larry pointed out, this works well for developers who are familiar with the logs, but can be hard to digest if an SRE or frontline ops engineer isn’t familiar with the application internals. The GPT-3 integration allows us to take the next step – distill these root cause reports down to concise natural language summaries by scanning the entire internet for occurrences of a similar incident, and extracting brief “English” descriptions for a user to scan.
After a few weeks of beta testing this feature with a limited group, and examining results from a couple of hundred incidents, we’re now ready to share some exciting results and expand access to ALL Zebrium users, even those on free trials.
In a nutshell – it works so well and in such a wide range of scenarios that we felt most users would benefit from having access to it. These summaries are both accurate and truly useful – distilling log events into a description a frontline or experienced engineer can easily understand.
First the caveats
This is still an early-stage feature for us, and there are cases where GPT-3 veers into guesswork and suggests summaries that seem related to the core RCA report, but aren’t exactly right. To make sure users know this, we tag the summaries with an “EXPERIMENTAL” badge in the UI.
There are also times the specific RCA report does not generate a particularly illuminating natural language summary beyond recapping the key log event(s). For instance –
- The first log message indicates that the node was not responding.
- The first log message is a fatal error indicating that the program detected a problem and aborted.
- The client sent a request to the server, but the server did not respond.
- The first log message shows that the **** task took *** ms to complete.
There are several possible reasons for these suboptimal outcomes. One possibility is that there simply aren’t enough examples of that type of issue in the public domain, so GPT-3 is responding with the closest details it can find. Another is that we haven’t yet explored all the variants of prompts and options we can use with the GPT-3 model.
The good news is that even when results are suboptimal, they are mostly not misleading and are easily ignored. More importantly, our ML-generated root cause summaries are the perfect input source for GPT-3, and with more work, the outcomes will only get better from here.
Now for the good part
The great news is that it actually works well more often than not, and the results are actually quite useful. Here are some examples where the GPT-3 summary really described the event collection accurately, and was really helpful to the user to quickly digest the RCA. Note: we have obfuscated details that might be potentially sensitive, and we’re not sharing the raw log events for the same reason, although they would be useful to compare alongside the summaries.
As a first bucket, here are some interesting and useful incident summaries related to memory starvation:
- The **** daemon was unable to allocate memory for the **** data.
- The RabbitMQ broker was running out of memory.
- The **** process was killed by the OOM killer.
- The application was trying to fork a child process, but the fork call failed because the system was out of memory.
- The memcached process was killed by the OOM killer because it was consuming too much memory. The OOM killer is a Linux kernel feature that allows the system to kill a process when the system is running out of memory.
- The memory cgroup was out of memory, so the kernel killed process **** and its child ****.
Then, here are some other infrastructure related incidents:
- The AWS Machine Image AMI that the customer used was for an x86_64 architecture, but the customer s instance type was arm64.
- The file system was corrupted.
- The Kafka producer was not configured to be a leader for the topic-partition.
- The root cause of the issue was that the Jenkins master was not able to connect to the vCenter server.
- The root cause was a drive failed error
- The cluster was under heavy load, and the scheduler was unable to schedule the pod.
- The pod was scheduled on a node that had insufficient CPU.
- The root cause was that the Slack API was rate limited.
For variety, here are some database related incidents:
- The database was closed, and the query failed.
- The EC2 instance was running out of connections to the database.
- The database driver was unable to ping the database server.
- The first message is a SQL error, which means that the database server was unable to execute the query.
Finally, here are some examples of security related incident summaries:
- The LDAP server was not responding to the client.
- The root cause of the issue was that the certificate chain did not match any of the trust anchors.
- The root cause of the problem was that the sshd daemon on the server was configured to allow only three authentication attempts per IP address.
- The server rejected the connection because it has already seen too many invalid authentication attempts for that user.
Summary
Our focus is to cut troubleshooting time using machine learning to summarize the key event sequences that describe an incident based on logs and associated metrics anomalies. The GPT-3 integration is a big step towards our goals – enabling quick review of RCA reports by anyone, even personnel who may not be intimately familiar with application internals. As described above – there are still improvements to be made, but it works so well in real world scenarios that we are now opening it up to all our users.
 See ScienceLogic in actionTake a Tour
 Take Skylar One for a SpinStart Your Test Drive
 The Gartner® Magic Quadrant™ for Observability PlatformsRead the Report
 The Forrester Wave™: AIOps Platforms, Q2 2025Access the Report
 What's New for Business ServicesRegister Today

